Measuring Intermetallic Layer Growth Rates in Surface Mount Solder Joints
Accurate intermetallic growth measurement requires targeted chemical etching, calibrated SEM imaging, and Arrhenius diffusion kinetic modeling.

Kinetics
At a solder joint interface, dissimilar metals exchange atoms through solid-state interdiffusion, forming brittle intermetallic compounds during reflow and thermal exposure. In surface mount assemblies, reactions between tin-based solders and common substrate metallizations—such as bare copper, nickel, or immersion gold over nickel—produce microscopic intermetallic compound layers. These layers show that a true chemical bond has formed between solder and pad.
Uncontrolled growth, however, degrades structural integrity, introducing brittle planes where mechanical shock, vibration, or thermal cycling can trigger failure.
As interdiffusion continues, tin depletion within the local matrix alters adjacent microstructural phases.
Solid-state interdiffusion drives compound expansion long after reflow. While diffusion remains slow at room temperature, elevated operating temperatures accelerate atomic transport across interfacial boundaries. Modeling phase evolution and growth kinetics helps reliability engineers forecast long-term joint performance, design valid accelerated thermal tests, and set clear physical acceptance thresholds for quality control.

Diffusion Mechanics at Solder Interfaces
Atomic migration across the boundary between copper substrates and tin-based solders yields distinct stoichiometric phases. During initial liquid reflow, molten tin rapidly dissolves surface copper, forming η-phase Cu6Sn5 crystals at the interface. As it solidifies, this primary intermetallic layer takes on a scallop-like morphology extending into the solder bulk.
Later solid-state thermal exposure alters the interface further, driving tin atoms toward the copper substrate and copper atoms into the solder matrix.
Solid-state growth eventually converts the single-layer structure into a dual-phase intermetallic stack. A secondary ε-phase Cu3Sn layer nucleates between the initial Cu6Sn5 layer and the copper substrate. This ε-phase layer grows by pulling copper directly from the substrate, while η-phase Cu6Sn5 continues consuming tin from the adjacent solder matrix.
The phase conversion creates internal stress from lattice mismatches and density differences between Cu6Sn5, Cu3Sn, and the copper beneath.
Isothermal aging at 125°C for 500 hours produces an average Cu6Sn5 layer growth of 2.1 micrometers in SAC305 joints.
Switching to nickel-based surface finishes like electroless nickel immersion gold alters growth kinetics. Nickel acts as a diffusion barrier, slowing atomic transport relative to bare copper. During reflow on nickel, the predominant phase is ternary (Ni,Cu)3Sn4 or binary Ni3Sn4, depending on the solder’s copper concentration.
Tin-lead alloys on nickel finishes form Ni3Sn4 intermetallics, whereas copper-containing lead-free SAC alloys yield complex (Cu,Ni)6Sn5 layers that resist rapid solid-state growth.
Calculating activation energy values across surface mount lots confirms batch uniformity.
Phase Transformations in SAC305 and SnPb Assemblies
Copper dissolves rapidly into liquid tin during reflow, precipitating η-phase Cu6Sn5 at the liquidus boundary. In traditional Sn63Pb37 eutectic joints, intermetallic growth stays slow at room temperature because solidus boundary mobility is low. Near-eutectic lead-free alloys like SAC305—comprising 96.5 percent tin, 3 percent silver, and 0.5 percent copper—require higher reflow temperatures and contain a higher volume fraction of tin.
This higher tin content boosts chemical activity at the interface, driving faster intermetallic growth during high-temperature operation.
Silver in SAC305 introduces another intermetallic into the solder bulk and interfacial region. Fine Ag3Sn platelets precipitate within bulk solder dendrites as the joint cools. Primary interfacial Cu6Sn5 and Cu3Sn dominate overall cross-sectional measurements, but Ag3Sn particles can migrate toward the reaction zone during extended thermal aging, altering localized growth kinetics and changing fracture paths under stress.
Activation Energy and Arrhenius Modeling
Solid-state growth rates follow parabolic power-law diffusion equations driven primarily by temperature. Reliability models use classical Arrhenius kinetics to estimate intermetallic thickness over product lifespans. Through these diffusion relationships, empirical measurements tie total layer thickness directly to operating temperature and exposure time.
Total layer thickness growth follows the standard parabolic growth equation expressed in Unicode notation:
x(t) = x0 + (D t)^0.5
In this equation, x(t) represents total intermetallic compound layer thickness at time t, x0 is initial intermetallic thickness right after reflow, D is the temperature-dependent diffusion coefficient, and t is exposure time in seconds. The diffusion coefficient D expands through the Arrhenius equation:
D = D0 exp(-Q / (R T))
Here, D0 is the frequency factor or pre-exponential constant, Q is activation energy in Joules per mole or electron-volts, R is the universal gas constant (8.314 Joules per mole-Kelvin), and T is absolute temperature in Kelvin. Taking natural logarithms yields a linear equation used to extract kinetic parameters from experimental aging data:
ln(D) = ln(D0) – (Q / R) (1 / T)
Determining activation energy Q experimentally requires measuring intermetallic thickness across at least three temperature regimes over multiple time intervals. Plotting squared thickness gain against time gives slopes corresponding to the diffusion coefficient D at each temperature. Plotting the natural logarithm of D against inverse absolute temperature (1/T) produces a straight line whose slope equals -Q/R. For total intermetallic growth in SAC305 on copper, typical activation energies fall between 0.65 eV and 0.85 eV, or 62.7 to 82.0 kilojoules per mole.
Elevated operating temperatures accelerate solid-state growth rapidly.
Whether sub-micron zinc additions to lead-free solder alloys can permanently suppress copper-tin interdiffusion under prolonged thermal stress remains an open engineering question.

Etch
Metallographic sample preparation transforms a raw circuit board cross-section into a measurable microscopic specimen. Inspecting interfacial intermetallic layers under optical or electron microscopes requires cutting, mounting, grinding, polishing, and chemical etching steps designed to expose clear boundaries without introducing mechanical deformation. Sub-micron intermetallic layers are easily damaged during preparation: improper polishing quickly smears soft solder over hard intermetallic compounds, masking true dimensions and corrupting image analysis.
Properly prepared cross sections expose underlying microstructural defects across the interface.
Repeatable laboratory procedures guarantee that observed growth rates reflect real solid-state diffusion rather than preparation artifacts. Quality assurance labs working on high-reliability printed circuit boards rely on precise cross-sectioning protocols to isolate critical solder joints while keeping edges flat across hard intermetallic interfaces and soft copper substrates.

Cross-Sectioning and Mounting Workflows
Precision diamond saws cut micro-section samples cleanly through designated solder ball centers without imparting mechanical shock. High-speed abrasive blades tend to induce micro-cracking within brittle Cu3Sn sublayers or delaminate pad interfaces. To prevent this, technicians isolate target component rows using low-speed diamond wafering blades lubricated with synthetic coolants, limiting local thermal input during sectioning.
Isolated specimens are mounted in clear epoxy or cold-curing acrylic resins. Room-temperature epoxies prevent heat from driving artificial intermetallic growth during mounting. Hot compression molding resins should be avoided entirely for solder joint cross-sections, as elevated temperatures and clamping pressures alter delicate phase boundaries and introduce residual stress.
Controlled polishing stages remove damaged surface layers without micro-smearing soft solder.
Mounted specimens are ground using silicon carbide papers of progressively finer grit, moving from 320 down to 1200 under constant water lubrication. This removes sectioning damage and establishes a flat plane through the solder ball centers. Automated polishing heads control down-force pressure and platen speed to prevent relief polishing between the soft bulk solder and hard intermetallic layers.
IPC-TM-650 Method 2.1.1 governs metallographic sample preparation, rejecting samples with micro-smearing artifacts.
Final polishing uses diamond suspensions from 3 micrometers down to 1 micrometer on short-nap silk cloths. Chemical-mechanical polishing with 0.04-micrometer colloidal silica completes the process, removing fine scratches and surface deformation. Colloidal silica combines mild chemical etching with polishing action, yielding scratch-free interfaces ready for electron microscopy.
Auditing PCB assembly lines in Dongguan verifies metallographic preparation protocols.
Chemical Revealing Solutions and Microstructural Contrast
Chemical reagents selectively strip matrix tin to highlight intermetallic topography under high magnification. Freshly polished surfaces show minimal optical contrast between tin-rich bulk solder, η-phase Cu6Sn5, and ε-phase Cu3Sn sublayers. Etching opens up grain boundaries, removes residual surface smearing, and highlights relief boundaries for automated optical or backscattered electron imaging.
Choosing an etchant depends on the solder alloy, substrate metallization, and target depth. Nitric acid solutions dissolve bulk tin rapidly, leaving intermetallics standing in relief. Ammonium hydroxide and hydrogen peroxide mixtures selectively etch copper substrates while preserving intermetallic profiles, making them ideal for measuring lower ε-phase interfaces.
Selective etching highlights grain boundaries and sharpens optical phase contrast.
Etching requires precise timing—typically two to ten seconds at room temperature—followed immediately by an isopropyl alcohol rinse and warm air drying. Over-etching dissolves fine features and undercuts thin sublayers, distorting thickness measurements. Under-etching leaves smeared solder over interfacial zones, creating false boundary lines during high-resolution imaging.
| Etchant Name | Chemical Composition | Immersion Time | Target Phase Isolation | Artifact Risk |
|---|---|---|---|---|
| Ammonium Hydroxide Peroxide | 50 mL NH4OH, 20 mL H2O2 (3%), 50 mL H2O | 3 to 8 seconds | Cu3Sn sublayer and Copper substrate boundary | Excessive copper substrate dissolution |
| Acidified Nitric Solution | 2 mL HNO3 (concentrated), 98 mL Ethanol | 2 to 5 seconds | Cu6Sn5 crystal relief and Sn bulk matrix | Rapid tin pitting and grain boundary staining |
| Hydrochloric Ferric Chloride | 5 g FeCl3, 10 mL HCl, 100 mL H2O | 5 to 10 seconds | Ni3Sn4 intermetallic layers on ENIG pad finish | Nickel surface finish pitting under extended contact |
| Glycerated Regia Mix | 10 mL Glycerin, 5 mL HNO3, 15 mL HCl | 1 to 4 seconds | Complex lead-free ternary phase boundaries | Severe localized pitting if surface moisture remains |
Standardized chemical preparation procedures follow sequential steps to deliver repeatable micro-sections:
- Cut the target solder joint array along the defined centerline using a low-speed diamond saw under continuous synthetic coolant flow.
- Encapsulate the specimen in low-viscosity room-temperature epoxy resin, degassing under vacuum for ten minutes to clear air pockets around component leads.
- Lp-grind mounted specimen on automated grinding wheel using 400, 800, and 1200 grit silicon carbide abrasive papers under constant water wash.
- Polish the mounted surface on short-nap cloth pads with 3-micrometer and 1-micrometer diamond suspensions at low speed and 15 Newtons down-force.
- Perform final chemical-mechanical polishing with a 0.04-micrometer colloidal silica suspension for two minutes to clear surface deformation.
- Immerse the polished section in the selected etchant for the specified dwell time, rinse immediately with pure isopropyl alcohol, and dry under filtered nitrogen gas.
Excessive polishing introduces relief bevels that artificially inflate microscopic intermetallic readings.

Imaging
Optical instruments hit hard diffraction limits when resolving thin sub-micron intermetallic layers. Standard light microscopes reach maximum theoretical resolutions around 0.2 micrometers under oil immersion, making it very difficult to measure initial reflow layers accurately when they fall between 0.3 and 0.8 micrometers. High-resolution platforms like scanning electron microscopy with backscattered electron detection, focused ion beam sectioning, or transmission electron microscopy are necessary to map these interfaces clearly.
Uncalibrated measurements often show dimensional drift across thermal aging datasets.
Accurate measurement workflows require rigorous calibration, precise line-intercept algorithms, and consistent image segmentation rules. Digital image analysis must distinguish adjacent phases with similar atomic densities while accounting for localized interfacial roughness, grain boundary grooves, and the scallop structures typical of reflowed joints.

Which Imaging Method Isolates Submicron Intermetallic Interfaces?
Scanning electron microscopy in backscattered electron mode distinguishes copper-rich phases using atomic number contrast. Signal intensity scales with average atomic number (Z), allowing copper (Z=29), Cu3Sn (average Z=41.5), Cu6Sn5 (average Z=44.1), and tin (Z=50) to appear as distinct grayscale shades. This contrast provides high signal-to-noise ratios across polished sections so digital analysis tools can reliably trace phase boundaries.
Polishing scratches masquerade as interfacial phase boundaries when illumination angles align with grinding marks.
Energy-dispersive X-ray spectroscopy paired with scanning electron microscopy verifies chemical stoichiometry across individual phases. Quantitative element mapping checks atomic ratios of copper, tin, and nickel to determine whether a dark line at the interface is ε-phase Cu3Sn or micro-voiding. Line scans across joint sections trace composition gradients, identifying sub-micron interdiffusion zones that backscattered electron imaging alone might miss.
| Measurement Platform | Lateral Spatial Resolution | Depth Resolution | Primary Phase Isolation Mechanism | Dominant Artifact Risk |
|---|---|---|---|---|
| Optical Brightfield Microscopy | 200 to 300 nanometers | 500 nanometers | Reflective color and relief contrast | Edge diffraction blurring thin sublayers |
| SEM Backscattered Electron Detector | 5 to 10 nanometers | 50 to 100 nanometers | Atomic number contrast differences | Topographical relief shadowing along etch lines |
| Focused Ion Beam Scanning Electron System | 1 to 3 nanometers | 5 to 10 nanometers | Secondary electron imaging during ion milling | Gallium ion implantation and surface sputtering curtaining |
| X-Ray Micro-Computed Tomography | 0.5 to 1.5 micrometers | 0.5 to 1.5 micrometers | X-ray attenuation density mapping | Beam hardening artifacts and insufficient resolution for thin sublayers |
Automated Image Segmentation and Thickness Extraction
Digital line-intercept algorithms measure thickness across hundreds of points to eliminate operator bias. Manual point-to-point measurements introduce personal bias because operators naturally choose flat, uniform sections while ignoring scallop peaks or interfacial troughs. Automated analysis tools construct normal vectors along substrate baselines, dividing exact layer area by baseline length to find true mean thickness.
Calculating intermetallic compound layer thickness uses the area-equivalent mathematical formula:
h_avg = A / L
Where h_avg represents mean intermetallic layer thickness, A represents total cross-sectional area of target intermetallic phase measured through digital image thresholding, and L represents parallel baseline length along substrate interface. When intermetallic interfaces show extreme scallop formations, linear intercept sampling at fixed increments supplements area calculations to calculate standard deviations and peak-to-valley thickness ratios.
Linear intercept sampling divides baseline length L into N equal increments. At each position i, a perpendicular vector measures local intermetallic thickness h_i. Mean thickness follows standard arithmetic averaging:
h_mean = (1 / N) sum(h_i from i=1 to N)
Standard deviation s provides a quantitative metric for interfacial layer roughness and scallop maturity:
s = ((1 / (N – 1)) sum((h_i – h_mean)^2 from i=1 to N))^0.5
Scallop geometries in early reflow stages produce large standard deviations relative to mean thickness. Thermal aging drives grain boundary migration and planar smoothing, reducing standard deviation s relative to total thickness over time.
Intermetallic layer thickness increases rapidly during early solid-state aging.
Optical measurement understates interfacial layer thickness whenever polishing plane tilt exceeds the true perpendicular cut angle.


Shear
Mechanical integrity degrades as interfacial intermetallics grow thicker and undergo phase transformation. Joint strength relies on maintaining a tough, ductile structure capable of absorbing cyclic energy without initiating brittle fractures. Compared to bulk solder, intermetallic compounds have a higher elastic modulus and lower fracture toughness.
As solid-state thermal aging thickens these layers beyond critical thresholds, failure modes shift from ductile matrix tearing to fast, catastrophic interfacial cleavage.
Cracks propagate rapidly through brittle intermetallic sublayers under dynamic loading.
Quantifying joint degradation requires correlating measured intermetallic thickness against shear force metrics from micro-ball shear testing or high-speed impact evaluation. Tracking fracture surfaces after shear tests exposes exact failure paths, confirming whether breakdown occurred within bulk solder, along η-phase Cu6Sn5 boundaries, or across Kirkendall void arrays embedded in sub-micron ε-phase Cu3Sn sublayers.
Micro-Ball Testing Mechanics and Strain Rates
Precision blades strike solder spheres at specific tip heights to evaluate interfacial fracture energy. Standard micro-ball shear testing operates at low strain rates, advancing the ram blade across spheres at 100 to 700 micrometers per second. Ram clearance above pad metallization must be kept at exactly 10 percent of solder ball height to prevent blade drag against the pad finish without applying excessive tipping forces.
Blade tip height directly affects stress distribution and measured shear values.
High-speed impact ball shear testing applies ram velocities between 1.0 and 5.0 meters per second, replicating drop impact stresses in portable electronics. Low strain rate testing evaluates ductile solder deformation, whereas high-speed shear concentrates stress directly in interfacial intermetallic zones, exposing microstructural weaknesses caused by excessive growth or void nucleation.
Interfacial shear strength drops significantly once brittle compound phases dominate the boundary.
Planar brittle fractures occur at the ε-phase boundary during high-velocity impact tests.
Fracture Path Transition and Ductile Brittle Shifts
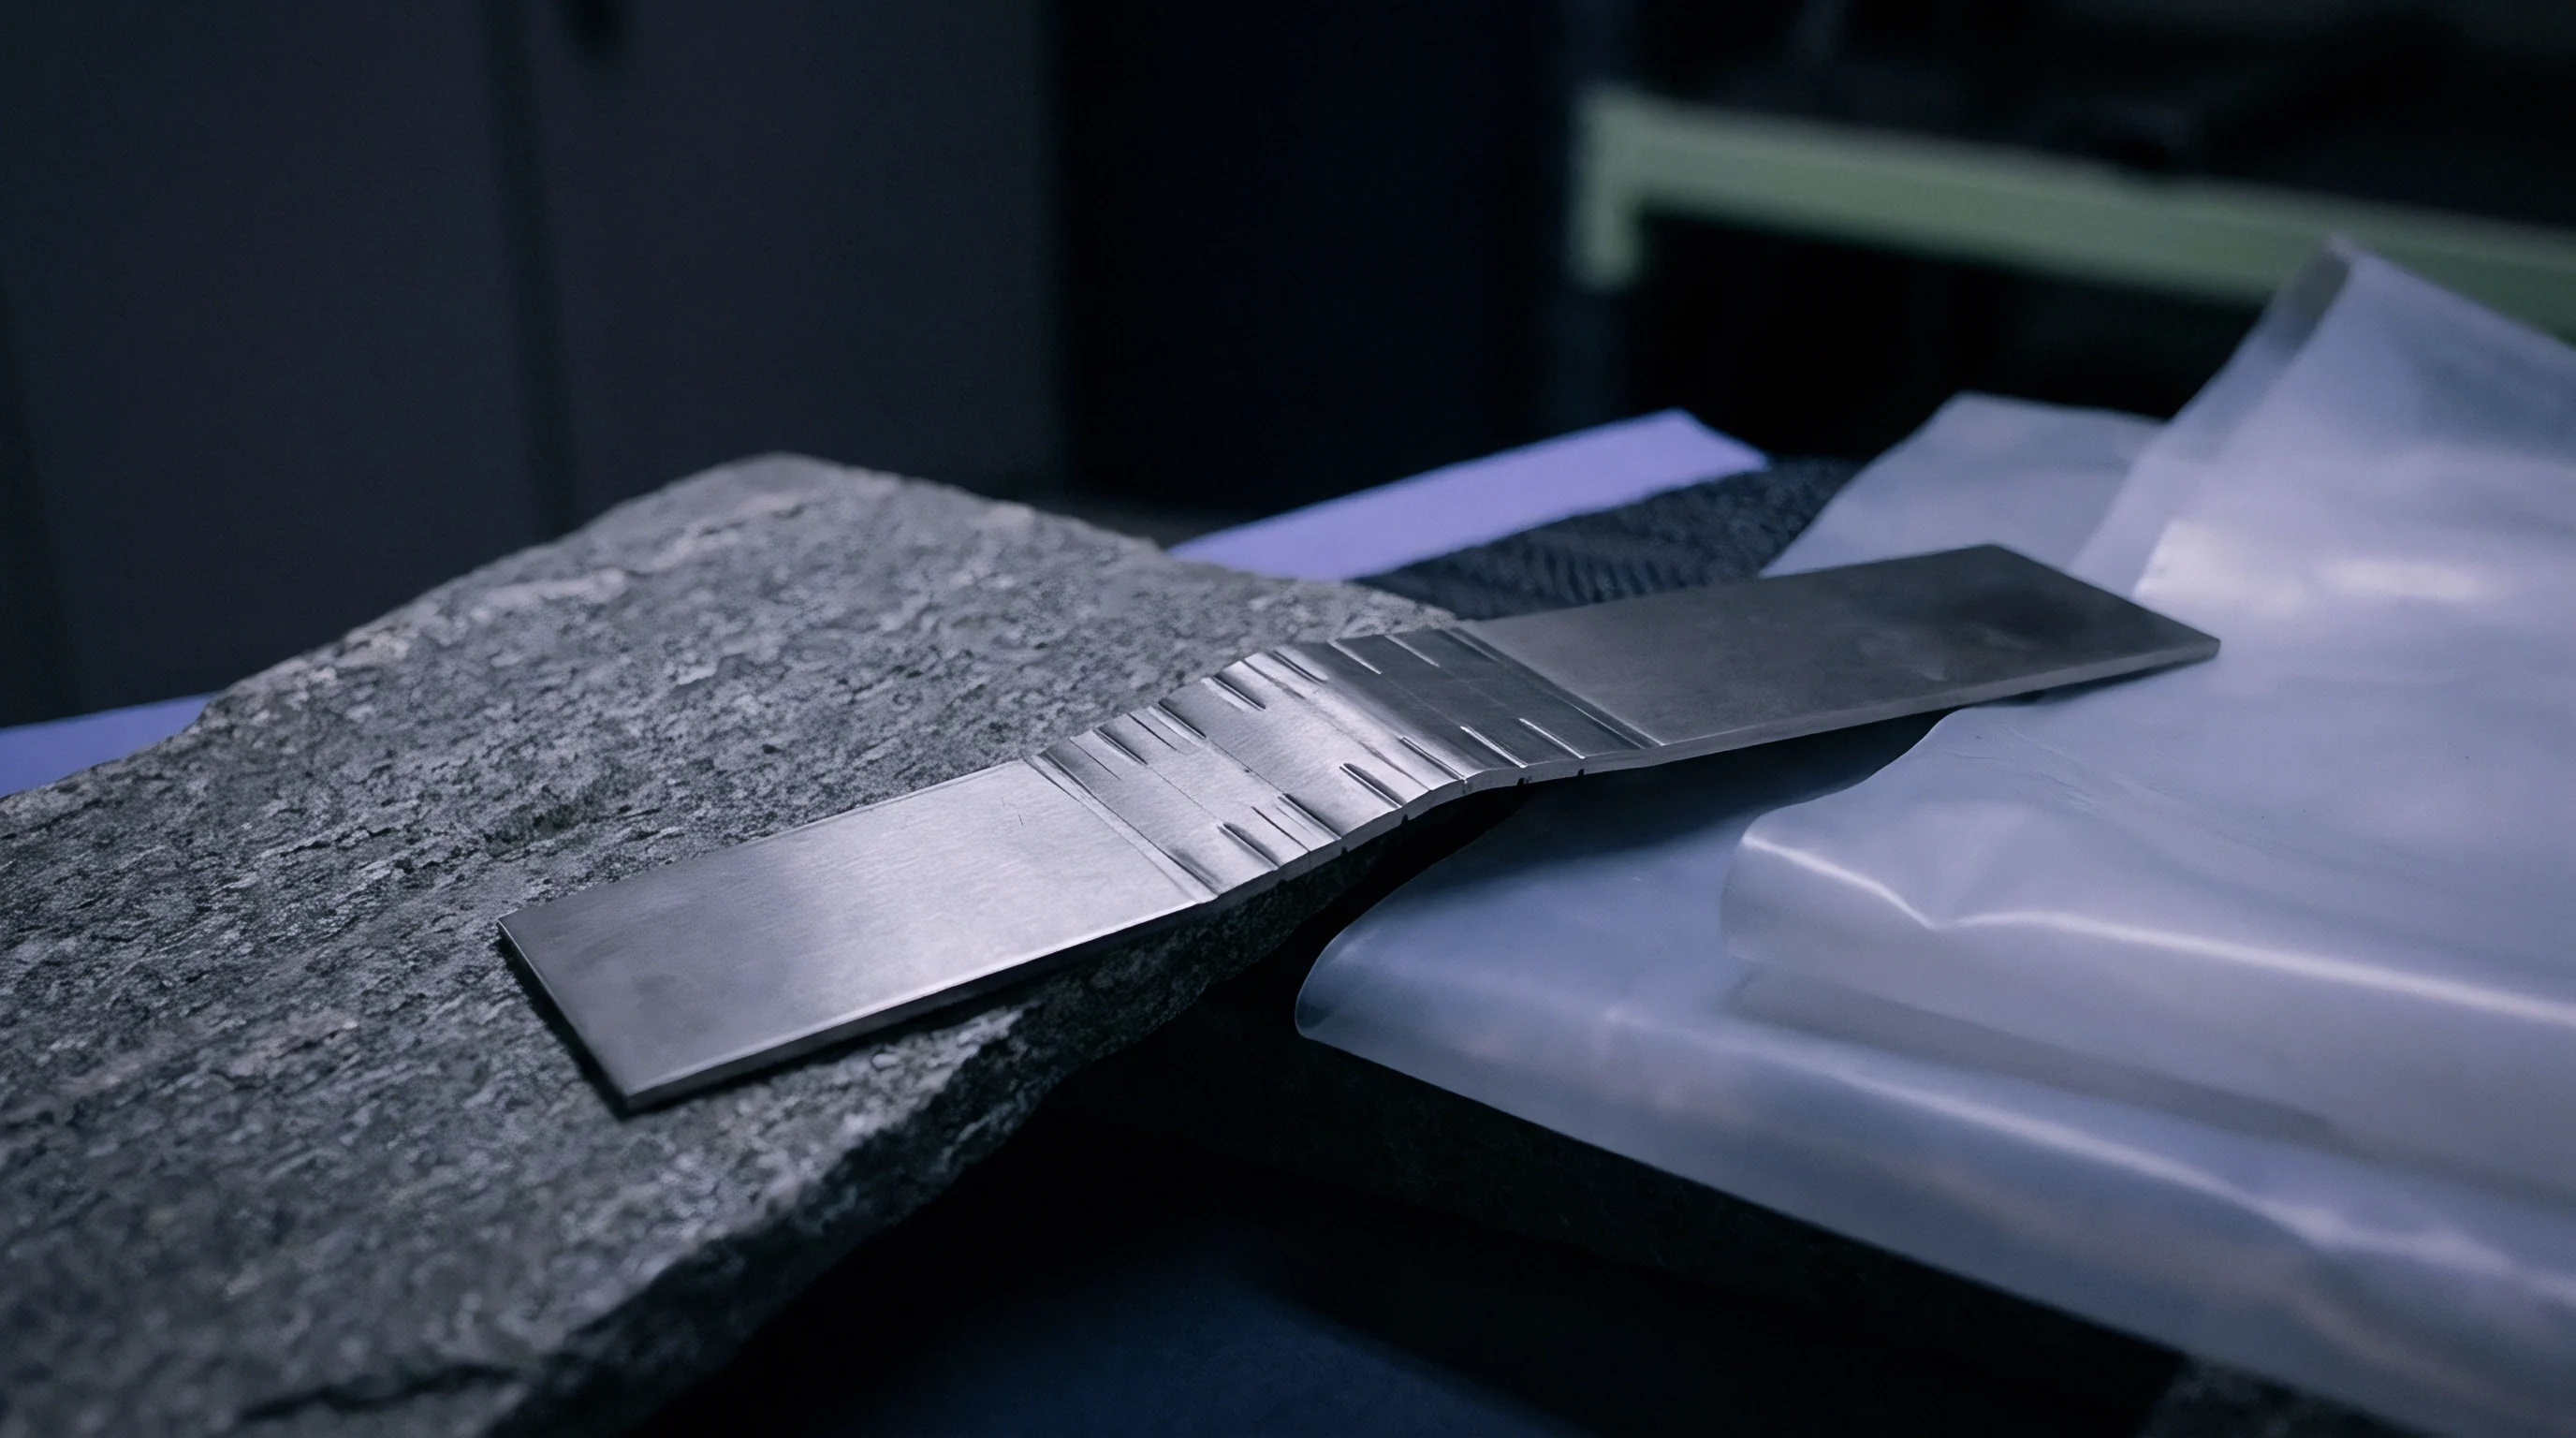
In un-aged joints, cracks propagate through the ductile solder matrix during shear testing, exhibiting high shear strength and significant plastic deformation. Microscopic inspection of these fracture surfaces reveals classic dimpled ductile topologies. Extended heat exposure, however, shifts the failure path toward planar interfacial cleavage.
Extended thermal aging alters fracture behavior entirely. As total intermetallic thickness grows beyond 3 to 4 micrometers, structural rigidity along the pad interface increases. High shear stresses concentrate within fragile compound sublayers rather than dispersing through soft solder matrix.
Under high-speed strain, cracks initiate along the ε-phase Cu3Sn interface or between Cu3Sn and copper metallization, resulting in flat, featureless brittle cleavage across the joint footprint.
| Isothermal Exposure Profile | Mean Total IMC Thickness | Cu3Sn Sublayer Thickness | Low-Speed Shear Force (100 μm/s) | Dominant Mechanical Failure Mode |
|---|---|---|---|---|
| As-Reflowed Baseline | 0.65 micrometers | 0.05 micrometers | 14.2 Newtons | 100% Ductile bulk solder matrix fracture |
| 125°C for 250 Hours | 1.85 micrometers | 0.35 micrometers | 13.8 Newtons | 85% Ductile matrix / 15% Interfacial cleavage |
| 125°C for 1000 Hours | 3.45 micrometers | 1.10 micrometers | 11.2 Newtons | 40% Ductile matrix / 60% Interfacial cleavage |
| 150°C for 1000 Hours | 5.80 micrometers | 2.25 micrometers | 7.5 Newtons | 10% Ductile matrix / 90% Brittle Kirkendall cleavage |
| Summary Note: Test values measured on 400-micrometer SAC305 solder spheres on non-solder-mask-defined copper pads. | ||||
Quantifying structural degradation requires evaluating physical metrics derived from shear force curves and microscopic fracture surface topologies:
- Shear Peak Load measures the maximum mechanical force sustained prior to joint failure during test blade impact.
- Energy Absorption Capacity calculates total integrated area beneath load-displacement curves, indicating energy absorbed before fracture propagation.
- Brittle Fracture Percentage quantifies the relative surface area showing flat cleavage modes under scanning electron microscopy post-shear.
- Kirkendall Void Density counts microscopic vacancies per linear millimeter along Cu3Sn/Cu substrate interfaces, tracking void coalescence driven by unequal atomic diffusion rates.
Unidentified sub-micron Kirkendall voiding in supplier cross-section reports leads to severe line qualification delays and scrap rejections.

Thermal
Environmental test chambers subject test coupons to sustained high temperatures to accelerate diffusion mechanisms. Thermal exposure protocols isolate temperature and time parameters, enabling direct empirical measurement of intermetallic growth rates. Accelerating these solid-state reactions lets quality control teams forecast long-term field stability without waiting years for operational failures.
Thermal parameters must be selected carefully to avoid introducing artificial phase transformations that never occur within normal operating envelopes.
Void coalescence along grain boundaries reduces overall structural load capacity.
Proper experimental design pairs rigorous isothermal aging profiles with accelerated thermal cycling regimes. Combining constant thermal exposure with cyclic mechanical strain provides holistic reliability data, validating Arrhenius predictions against the multi-axial stress environments found in real-world electronics.
Isothermal Aging Matrix Design
Test matrix selection balances exposure temperatures against matrix degradation thresholds to maintain valid diffusion mechanics. Isothermal aging regimes typically utilize three exposure temperatures: 125°C, 150°C, and 175°C. Exposures above 175°C risk exceeding solidus temperatures or inducing polymer substrate glass transitions that distort physical diffusion, producing non-Arrhenius artifacts that corrupt kinetic calculations.
Test coupons are withdrawn from thermal chambers at set intervals—typically 100, 250, 500, 750, and 1000 hours. Immediate cold mounting freezes diffusion states, preventing continued intermetallic expansion post-withdrawal. Analyzing multiple time increments across three distinct temperatures provides enough data points to plot parabolic growth curves and calculate solid-state activation energy values accurately.
Thermal aging drives solid-state transformation of η-phase copper-tin compound into brittle ε-phase sublayers.
Accelerated thermal cycling adds cyclic thermomechanical strain across solder joint boundaries alongside solid-state diffusion. Profiles cycling between -40°C and +125°C with 15-minute dwell times generate shear strain caused by CTE mismatches between component bodies, solder alloys, and printed circuit board laminates. Combined thermomechanical stress accelerates atomic defect generation and vacancy migration, driving faster intermetallic growth than static isothermal exposure.

Arrhenius Parameter Extraction in Aging Trials
Plotting squared layer thickness growth against inverse absolute temperature yields empirical activation energy values. Mathematical processing transforms raw cross-section measurements into reliable lifetime predictions. Analyzing layer thickness gain across multiple temperature regimes isolates the diffusion rate constants needed to calculate long-term growth under field conditions.
Consider an engineering evaluation measuring intermetallic layer growth in SAC305 solder joints on bare copper. Baseline reflow cross-sections establish an initial mean thickness x0 of 0.50 micrometers. Isothermal aging trials yield experimental measurements after 500 hours of continuous thermal exposure across three test chamber regimes:
- Low Chamber Regime maintains 125°C (398.15 Kelvin), resulting in total measured intermetallic thickness x_125 of 1.80 micrometers.
- Medium Chamber Regime maintains 150°C (423.15 Kelvin), resulting in total measured intermetallic thickness x_150 of 2.60 micrometers.
- High Chamber Regime maintains 175°C (448.15 Kelvin), resulting in total measured intermetallic thickness x_175 of 3.80 micrometers.
Calculations begin by isolating squared thickness growth values delta_x_sq for each temperature profile over exposure time t equal to 500 hours (1,800,000 seconds):
At 125°C: delta_x_125 = 1.80 μm – 0.50 μm = 1.30 μm = 1.30 10^-6 meters. Squared thickness gain delta_x_sq_125 equals 1.69 10^-12 square meters. Diffusion coefficient D_125 equals delta_x_sq_125 / t = (1.69 10^-12 m^2) / (1,800,000 s) = 9.39 10^-19 m^2/s.
At 150°C: delta_x_150 = 2.60 μm – 0.50 μm = 2.10 μm = 2.10 10^-6 meters. Squared thickness gain delta_x_sq_150 equals 4.41 10^-12 square meters. Diffusion coefficient D_150 equals delta_x_sq_150 / t = (4.41 10^-12 m^2) / (1,800,000 s) = 2.45 10^-18 m^2/s.
At 175°C: delta_x_175 = 3.80 μm – 0.50 μm = 3.30 μm = 3.30 10^-6 meters. Squared thickness gain delta_x_sq_175 equals 10.89 10^-12 square meters. Diffusion coefficient D_175 equals delta_x_sq_175 / t = (10.89 10^-12 m^2) / (1,800,000 s) = 6.05 10^-18 m^2/s.
Next, natural logarithms of diffusion coefficients are plotted against inverse absolute temperatures (1/T):
1/T_125 = 1 / 398.15 K = 2.5117 10^-3 K^-1. ln(D_125) = ln(9.39 10^-19) = -41.51.
1/T_150 = 1 / 423.15 K = 2.3632 10^-3 K^-1. ln(D_150) = ln(2.45 10^-18) = -40.55.
1/T_175 = 1 / 448.15 K = 2.2314 10^-3 K^-1. ln(D_175) = ln(6.05 10^-18) = -39.64.
Linear regression of ln(D) against 1/T calculates slope m = -Q / R. Between 125°C and 175°C, slope m evaluates to approximately -6672 Kelvin. Multiplying this negative slope by the universal gas constant R (8.314 J/mol·K) yields an activation energy Q = 55,471 Joules per mole, or 0.575 electron-volts.
Using this extracted activation energy Q and pre-exponential frequency factor D0, kinetic modeling predicts long-term intermetallic growth in the field. For an assembly operating at 55°C (328.15 Kelvin) continuously for five years (157,680,000 seconds), the calculated diffusion coefficient D_55 is 2.38 10^-20 m^2/s. Calculated thickness growth delta_x_55 equals (D_55 t)^0.5 = 1.94 micrometers, bringing total field intermetallic layer thickness to 2.44 micrometers.
This prediction confirms joint stability remains safely below the critical 4.0-micrometer embrittlement threshold throughout its intended operational life.
Clause 4.3 of J-STD-020 defines exposure thermal profiles, forcing board assemblers to recalculate lifetime interfacial thermal budgets before qualifying reflow ovens.


Settle
Independent laboratory audits in major electronics manufacturing hubs verify cross-section reports against real physical samples. Manufacturing operations spread across international borders frequently encounter gaps between raw micro-section inspection data reported by factory quality teams and true microstructural joint conditions. Third-party validation establishes operational transparency, confirming that reflow parameters and substrate metallization comply with contractual reliability standards.
Independent verification helps prevent premature field failures and warranty claims.
Evaluating laboratory capabilities across South China manufacturing centers requires inspecting equipment calibration histories, sample preparation workflows, and image segmentation routines directly on site. Establishing clear contractual specifications regarding maximum allowable intermetallic growth rates protects purchasing organizations from bearing long-term warranty costs caused by poor manufacturing controls or substandard surface finish plating.

Laboratory Oversight in Mainland Solder Failure Analysis
Third-party test centers in Shenzhen and Dongguan provide rapid micro-sectioning results, but these require strict procedural review. Quality directors managing offshore assembly lines audit contract labs directly to verify that technicians follow IPC-TM-650 sample preparation rules rather than taking rapid grinding shortcuts. Inexpensive sectioning services often apply excessive polishing down-force or skip fine colloidal silica polishing steps, producing smearing artifacts that distort recorded intermetallic layer metrics.
Quality teams hold test laboratories directly accountable for microstructural interpretation errors in incoming component batches.
Audit routines inspect metallographic mounting resin selection, grinding abrasive refresh cycles, and electron microscope spatial calibration records. Reports issued by factory-internal labs require periodic cross-validation by accredited independent micro-analysis centers to verify backscattered electron grayscale separation rules and eliminate operator bias during area-equivalent thickness measurements.

Commercial Risk Management for Intermetallic Reliability
Supply contracts specify maximum allowable layer growth rates following standard burn-in cycles to protect field longevity. Commercial agreements incorporate explicitly stated maximum intermetallic thickness thresholds measured immediately post-reflow and after standard 100-hour 125°C thermal stress screening. Including clear quantitative limits within master supply agreements enables procurement teams to reject substandard lots before assemblies enter global distribution chains.
Contractual specifications establish maximum post-reflow initial intermetallic thickness limits at 1.0 micrometer for standard SAC305 on copper finishes, capped with an absolute upper boundary of 3.5 micrometers following burn-in testing. When suppliers fail these microstructural criteria, contractual clauses reallocate sorting, cross-section re-inspection, and board replacement expenses directly back to the assembly contractor.
Enforcing rigorous intermetallic growth rate standards transforms abstract solid-state physics into concrete quality control. Procurement teams that pair precise Arrhenius kinetic modeling with unannounced laboratory audits can reliably manage interfacial degradation across overseas production bases.