Early Detection Signals for Automated Electronics Assembly Line Failures
Early detection on automated assembly lines relies on tracking vacuum decay, solder slump, and inspection false calls before board defects occur.

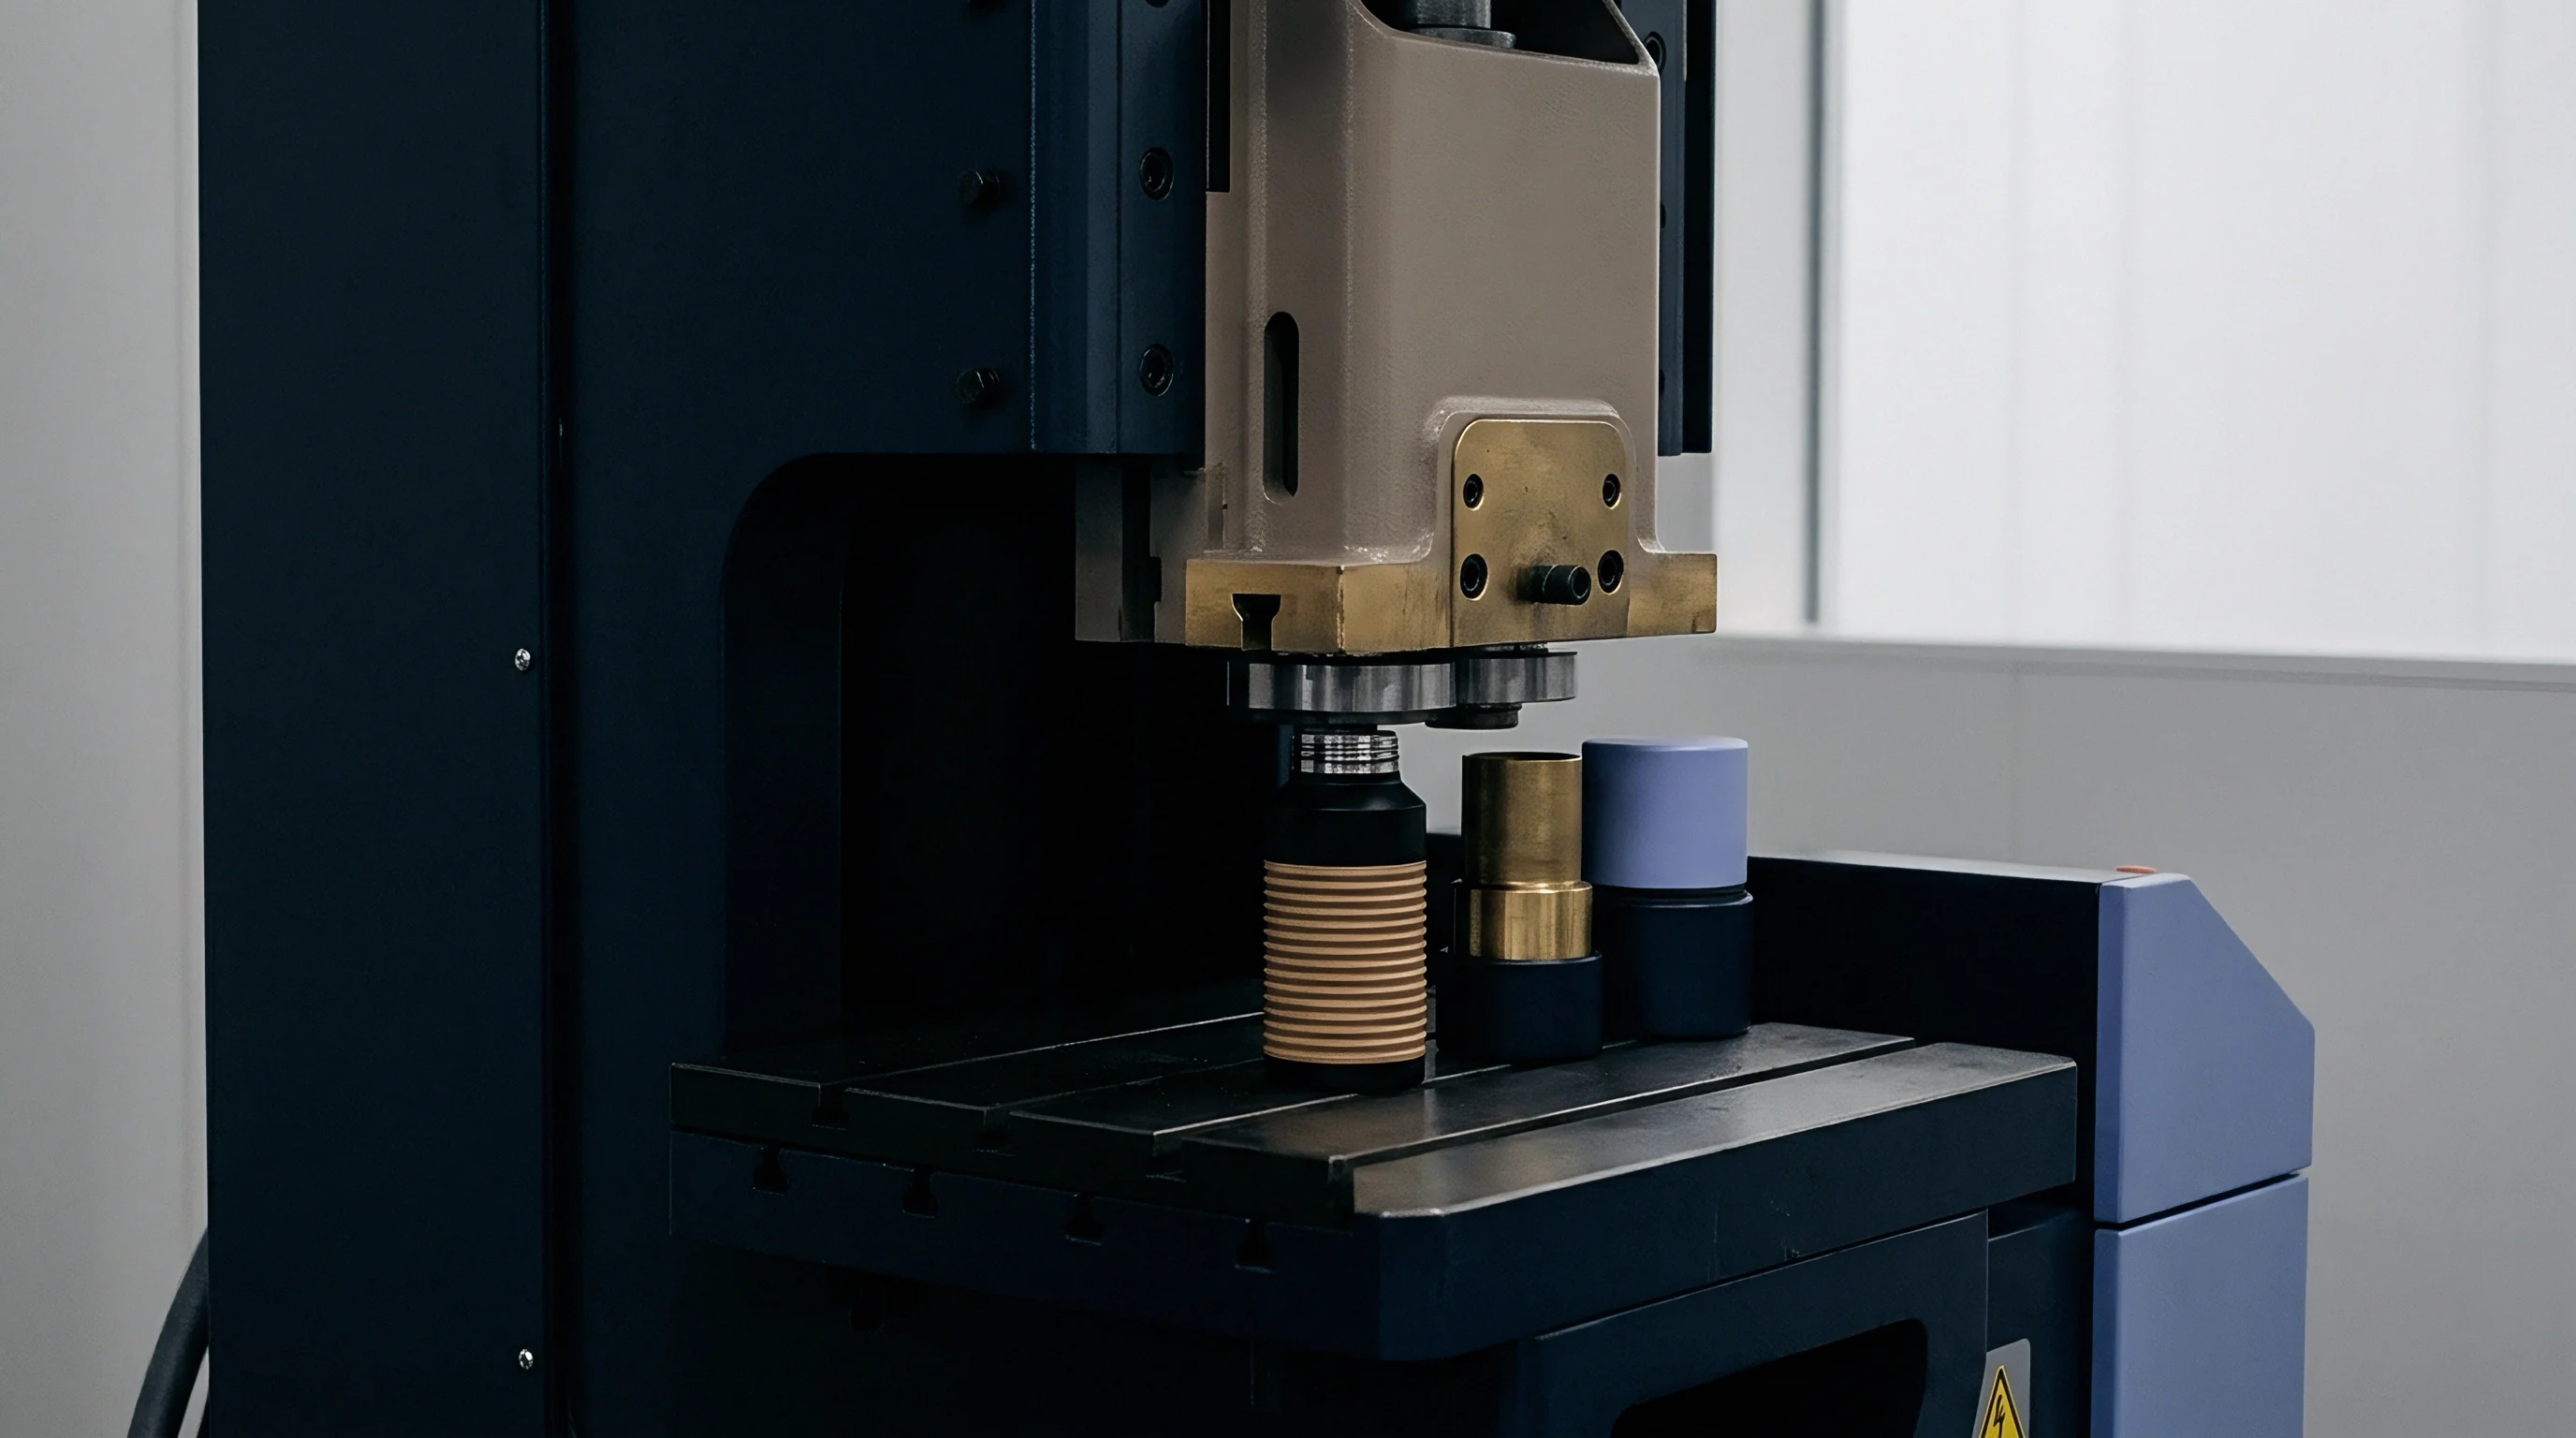
Nozzle
Vacuum transducer logs on high-speed surface mount placement heads record pressure drops long before component placement fails outright. Suction cups and ceramic tips encounter mechanical wear, solder paste pickup residue, and micro-cracks during continuous production runs. Automated pick-and-place equipment relies on stable pneumatic vacuum levels to pull components from carrier tapes, hold them during high-speed gantry moves, and position them onto printed circuit board pads.
When vacuum levels degrade, pick-and-place heads experience subtle component shifts mid-transit, producing tombstoning, misaligned leads, or dropped parts that stall downstream operations.

Pneumatic Vacuum Decay Signatures
SMT placement equipment measures internal line pressure in millibars during component transit across the assembly line. Baseline vacuum levels for standard 0402 and 0201 passive components hold between minus 80 and minus 90 kilopascals. When internal tip bore contamination accumulates, effective vacuum pressure bleeds off toward minus 60 kilopascals.
Vacuum drops fast. The placement machine compensates by extending vacuum dwelling times, adding milliseconds to every placement stroke. Line operators monitoring real-time pneumatic telemetry catch this dwelling extension six to eight hours before nozzle drop error alarms trigger line stops.
| Sensor Signal | Nominal Baseline | Early Warning Threshold | Downstream Line Failure Mode |
|---|---|---|---|
| Pneumatic Vacuum Pressure | -85 kPa to -92 kPa | -65 kPa to -70 kPa | Dropped components and bill-of-materials count loss |
| Placement Head Z-Axis Force | 1.5 N to 2.0 N | 2.8 N to 3.5 N | Component cracking and solder paste squeeze-out |
| Optical Target Reflectance | 95% clean ratio | 82% clean ratio | Vision alignment retries and component rotation errors |
| Nozzle Dwell Time | 12 ms to 15 ms | 22 ms to 30 ms | Tact time slip and gantry synchronisation failure |

Optical Reflectance Drift on Calibration Targets
Upward-looking cameras evaluate component position relative to the mechanical center of the suction tip prior to board placement. Modern vision systems illuminate the underside of the component while measuring reflection off the nozzle tip face. Nozzles wear down.
Solder paste flux residue gradually coats the matte black tip face, altering its optical contrast ratio. The placement head camera records increasing reflection noise, causing repeated alignment recalculations. Defect rates double.
A nozzle experiencing optical reflectance drift will initiate two to three vision alignment retries per component placement cycle, increasing line cycle times while remaining below hard fault thresholds.
A vacuum decay exceeding 45 millibars per second across three consecutive pickup attempts correlates with a ninefold increase in tombstoning rates during reflow.
Monitoring z-axis placement force provides another early degradation indicator. When mechanical return springs inside placement spindles lose calibration, the machine exerts excessive force during component landing. Solder paste squeezes out laterally beneath component terminals, creating micro-bridges that bridge adjacent pads during reflow soldering.
Sensor telemetry recording z-axis impact force spikes above 3.0 Newtons identifies spindle spring fatigue prior to widespread solder bridging defects across fine-pitch quad flat no-lead components. Line operators frequently maintain that vacuum errors stem entirely from component tape carrier static pockets rather than suction bore contamination.


Flux
Solder paste rheology alters significantly when ambient humidity on the factory floor shifts beyond specified tolerances during long production shifts. Solder paste consists of metallic alloy powder suspended in a liquid chemical vehicle containing solvents, activators, and thixotropic gelling agents. Environmental exposure inside automated stencil printing equipment causes solvent evaporation, altering viscosity and paste slump characteristics.
Tracking chemical stability and thermal profiling continuous signals prevents widespread soldering defects across complex multi-layer assemblies.

Rheological Slump and Solvent Volatilization
Viscosity measurements taken directly from stencil printing banks indicate chemical breakdown prior to print bridging or solder balling events. As paste sits on the stencil under continuous squeegee shear forces, volatile solvents evaporate into ambient air. Viscosity increases initially, reducing paste transfer efficiency through fine-pitch stencil apertures.
Paste slumps quickly. Sub-hundred-micron aperture openings for 0.4 millimeter pitch ball grid arrays suffer volume deficits first. Real-time viscosity monitoring via inline rheometers flags solvent loss when shear viscosity drifts beyond ten percent of fresh paste specifications.

Reflow Thermal Gradient Deviations
Continuous thermal profiling sensors record heating zone variance down to tenths of a degree Celsius across multi-layer circuit boards. Reflow ovens utilize forced convection heating zones to evaporate flux solvents, activate oxide-clearing chemistry, and melt metallic solder alloys. Thermal drift spreads.
Element degradation in intermediate pre-heat zones alters the temperature ramp rate, leaving unevaporated solvent trapped inside wet solder joints.
- Measure solder paste viscosity using a spiral pump viscometer at ten revolutions per minute prior to loading stencil banks.
- Record ambient relative humidity and temperature near the stencil printer work envelope every two hours during active production shifts.
- Perform acid number titration on incoming chemical shipments using standardized potassium hydroxide solutions to verify activator concentration.
- Attach a six-channel thermocouple profiler to a test board substrate and run the unit through all heating zones twice per day.
- Calculate peak temperature duration above liquidus for every fine-pitch ball grid array location on the test assembly layout.
Consider a thermal profile degradation model on a 12-layer high-density interconnect circuit assembly. Assume a 12-layer substrate carrying 0.4 millimeter pitch ball grid array components, ambient factory floor temperature at 24°C, conveyor speed set at 0.85 meters per minute, and peak reflow zone temperature specified at 245°C. Over two hundred continuous operating hours, heating element aging inside reflow zone 4 creates a 3.5°C drop below nominal setpoints. Solder paste slumps.
Solvent volatilization decelerates during the soak phase, causing residual activator vehicle to remain under component bodies. Calculated void percentage inside solder joints increases from a baseline of 3.2% to 14.8% across inner BGA array balls. This void growth stays invisible to standard post-reflow automated optical inspection, surfacing only during subsequent functional testing or board X-ray inspection.
Solder paste left exposed on an idle stencil absorbs atmospheric moisture until thermal spattering creates micro-solder balls across adjacent trace gaps.
Chemical decomposition of rosin activators manifests as acid number reduction. When liquid flux or solder paste experiences temperature spikes in storage or on the line, active organic acids neutralize prematurely. The material loses its capacity to strip tin oxide layers from component leads during the 180°C to 217°C soak window.
Contractual compliance with IPC J-STD-004B Clause 4.3.2 dictates immediate rejection of solder paste lots exhibiting solvent loss beyond two percent by weight.


Vision
Automated Optical Inspection algorithms exhibit statistical variance long before physical joint bridging or solder insufficiency triggers a hard line stop. Modern surface mount assembly lines rely on 3D optical inspection post-print and post-reflow to verify component presence, orientation, alignment, and joint geometry. Inspection telemetry logs provide a sensitive early warning system for machine drift when quality teams analyze false call trendlines alongside measurement distribution shifts.

Do False Positive Spikes Precede Real SMT Line Failures?
False positive inspection alarms increase sharply three to six operating hours prior to true component alignment failure. When pick-and-place calibration shifts or conveyor rails experience subtle thermal expansion, component placement distribution centers drift away from nominal pad coordinates. Inspection alarms trigger.
Automated inspection algorithms initially flag these parts as marginal deviations, generating false calls that line operators clear manually. False calls spike. Analyzing the ratio of cleared false calls against true defects reveals that a three-sigma drift in component centerlines generates an exponential spike in false positive events before generating true out-of-spec defects.
| Inspection Stage | Telemetry Metric | Normal Operating Window | Pre-Failure Signal | Root Failure Cause |
|---|---|---|---|---|
| Solder Paste Inspection (SPI) | 3D Deposit Volume Ratio | 95% to 110% nominal | 82% to 88% continuous drop | Stencil aperture clogging or paste dry-out |
| Solder Paste Inspection (SPI) | Paste Deposit Offset | < 0.02 mm X/Y deviation | 0.04 mm to 0.06 mm drift | Stencil alignment pin wear or board stretch |
| Automated Optical (AOI) | Component Rotation Angle | < 0.5 degrees | 1.2 to 1.8 degrees drift | Pick head spindle belt slip or nozzle wear |
| Automated X-Ray (AXI) | BGA Void Area Percentage | < 5% total joint area | 12% to 18% void trend | Reflow profile soak zone thermal collapse |

Three Dimensional Volumetric Solderpaste Measurement Drift
Telemetry captured at the stencil printer output logs volume variations down to individual component pads across the PCB layout. Stencils clog rapidly. Three-dimensional solder paste inspection systems measure deposit height, area, and total solder volume using structured light projection.
When stencil apertures accumulate dried paste along their inner walls, volume measurements exhibit localized downward trends. A continuous volume reduction of five percent over ten consecutive printed boards flags aperture clogging hours before paste deposit volumes drop below the absolute specification limit of seventy percent.
- Component Edge Shadowing Lighting angle decay in two-dimensional optical systems creates false tombstone readings on tall ceramic capacitors during inspection runs.
- Lead Coplanarity Offset Three-dimensional laser profiling detects pin height elevation above five hundredths of a millimeter before reflow soldering occurs.
- Volumetric Print Deficit Stencil aperture clogging reduces solder paste volume below eighty percent of nominal aperture capacity across fine-pitch pads.
- Solder Fillet Curvature Shift Meniscus profile analysis reveals insufficient wetting angle prior to mechanical shear testing failure on surface mount connectors.
Inspection camera recalibration records reveal that LED lighting decay in optical units accounts for one third of unexplained false positive spikes.
It remains unclear whether real-time neural network optical re-training can distinguish true component tilt from board warpage without manual engineering intervention.


Vibration
Conveyor rail drive belts develop micro-pitch variances that transmit subtle mechanical oscillations through the board transport chassis. Surface mount assembly lines transport un-soldered circuit boards across multiple process zones, including stencil printing, high-speed placement, multi-function placement, and reflow entry. Components rest in wet solder paste prior to reflow, relying solely on paste tackiness to maintain placement coordinates.
Mechanical vibrations transmitted through conveyor belts, worn transport rollers, or board clamping mechanisms dislodge delicate components, creating misalignments that bypass surface placement vision checks.

Conveyor Transport Kinematic Oscillations
Accelerometers mounted to edge-guide transport rails detect belt tooth wear before positional encoders register a velocity error. Belts slip over time. Transport drives utilizing timing belts experience drive pulley wear, belt tooth deformation, and bearing deterioration.
High-frequency vibration telemetry between 120 Hertz and 450 Hertz indicates mechanical chatter within conveyor drive gearboxes. Positional drift compounds. When an un-soldered board passes over a worn transport rail joint, kinematic shock pulses transfer directly into the substrate, shifting 0201 passives and fine-pitch QFP leads off their paste deposits.
| Sensor Location | Frequency Band | Signal Threshold | Resulting Downstream Line Defect |
|---|---|---|---|
| Conveyor Entrance Rail | 150 Hz to 220 Hz | > 0.45 g RMS acceleration | Component displacement in wet solder paste |
| Pick Head Gantry Frame | 50 Hz to 90 Hz | > 1.20 g peak displacement | Placement coordinate accuracy loss on X/Y axis |
| Feeder Mounting Bank | 300 Hz to 600 Hz | > 0.85 g RMS acceleration | Carrier tape indexing failure and tape misfeeds |
| Board Clamping Solenoid | Transient Impulse | > 2.50 g peak shock | Substrate flexure and paste deposit smearing |
Mechanical Feeder Indexing Chatter
Electric tape feeders lose registration precision when internal ratchet gears sustain mechanical wear. Board flex increases. Tape feeders advance component carrier tape at speeds exceeding twenty picks per second.
Mechanical chatter worsens. Feeder wear generates high-frequency mechanical vibration that travels across the feeder mounting bank, destabilizing adjacent tape pockets. Vibration sensors installed along the feeder chassis log peak-to-peak acceleration increases that correlate directly with component flipping, tape mis-indexing, and empty pocket pick attempts.
- Transport Belt Tension Verification Check drive belt frequency response using an acoustic tension meter during routine weekly line commissioning operations.
- Clamping Solenoid Force Audit Measure pneumatic board edge clamp holding force with a calibrated load cell at every scheduled maintenance interval.
- Feeder Rail Alignment Inspection Validate physical feeder interface coplanarity against the pick head coordinate axis to preserve mechanical registration.
- Board Support Pin Calibration Verify mechanical support pin height across the transport area to prevent substrate deflection during component placement strokes.
IPC-A-610H Class 3 manufacturing standards void assembly acceptance whenever board transport flexure exceeds half a millimeter per hundred millimeters of substrate length.
A feeder bank that generates mechanical chatter during component indexing eventually shakes adjacent delicate components out of wet solder paste before reflow entry.


Invoice
Uncontrolled assembly line defect drift surfaces on monthly financial ledgers as expedited freight costs and factory scrap debit memos. Catching assembly line failure signals during initial drift saves thousands of dollars per manufacturing shift. When early telemetry signals from nozzles, flux chemistry, optical inspection, and conveyor kinematics are ignored, defect propagation scales exponentially across continuous automated runs.
Distance multiplies expense.

Landed Cost Arithmetic of Uncaught Line Defect Drift
Scrapping a fully populated circuit board after reflow incurs four times the financial loss of dumping a single misprinted paste layout. Scrap costs compound. Downtime costs add up.
Calculate the direct financial loss of delayed defect detection across a production batch of 10,000 double-sided high-density interconnect assemblies. The bare board substrate costs $18. Total component bill-of-materials value equals $127 per assembly.
Stencil printing costs $0.35 per unit in consumable overhead.
Consider Scenario A, where automated solder paste inspection flags stencil aperture clogging within the second hour of production. The line stops automatically. The operator cleans the stencil and replaces one worn squeegee blade.
Fifteen boards are wiped clean and re-printed, incurring a total material scrap cost of $180 for solder paste and cleaning solvent. Total line downtime equals 25 minutes, valued at $350 in facility overhead. Net intervention cost totals $530.
Consider Scenario B, where line operators bypass inspection alarms to meet shift throughput targets. Ten thousand boards pass through pick-and-place and reflow ovens with un-detected solder paste deficits. Automated X-ray inspection catches 420 defective assemblies post-reflow.
Manual rework attempts repair on 250 boards, consuming $18 per unit in specialized labor ($4,500 total). The remaining 170 assemblies sustain un-repairable BGA pad damage during rework, forcing complete scrap write-offs at $145 per unit ($24,650 total). Emergency air freight for replacement component stock adds $8,200 to meet delivery deadlines.
Total failure cost reaches $37,350. Air freight rates spike. Yields drop sharply.
Margin disappears fast.
| Intervention Timing | Scrap Material Loss | Rework Labor Cost | Expedited Freight Charge | Net Landed Unit Impact |
|---|---|---|---|---|
| Pre-Print Signal (Paste Telemetry) | $12.00 total | $0.00 | $0.00 | +$0.001 per unit |
| Post-Print SPI Signal (Wipe & Re-print) | $180.00 total | $0.00 | $0.00 | +$0.018 per unit |
| Post-Placement AOI Signal (Pre-Reflow) | $1,250.00 total | $420.00 | $0.00 | +$0.167 per unit |
| Post-Reflow AXI Signal (Scrap & Rework) | $24,650.00 total | $4,500.00 | $8,200.00 | +$3.735 per unit |
| Assumes 10,000 unit batch run, $145 landed board valuation, and 4.2% uncaught defect drift rate post-reflow. | ||||

Supplier Scrap Allocations and Commercial Redress
Overseas manufacturing contracts allocate scrap allowances based on first-pass yield benchmarks established during prototype production runs. Contract electronics manufacturers routinely include a one to two percent scrap allowance within baseline unit pricing models. When line failure signals go unaddressed, defect rates rapidly exceed this contractual threshold.
Buyers who monitor early warning telemetry possess the verifiable sensor logs required to issue formal defect notices and enforce financial debit memos against manufacturing partners.
Catching stencil printing defects prior to component placement reduces scrapped material costs by ninety-two percent on high-density circuit assemblies.
Ignoring line telemetry drift converts controlled board manufacturing expenses into emergency air-freight charges and depleted warranty reserves.