Calibrating Temperature Dependent Butler Volmer Parameters for High Current Density Deposition
Calibrating temperature-dependent Butler-Volmer parameters at high current density requires real-time IR drop subtraction and interfacial thermometry.

Tank

Hydrodynamic Transport in High Amperage Plating
Continuous electrodeposition operated at elevated current densities between one and four amperes per square centimeter places severe physical demands on bath fluid mechanics. Electrolyte circulating through high-speed galvano-cells sweeps across the cathode interface to replenish metal ions removed by rapid reduction. At these electrochemical rates, the diffusion boundary layer thins to dimensions between ten and thirty micrometers, producing steep concentration gradients adjacent to the substrate.
Fluid velocity within the bulk cell must maintain turbulent shear to prevent localized ion starvation, yet fluid movement alone cannot eliminate thermal accumulation generated by severe charge passage.
Electric current crossing the electrolyte resistance generates substantial volumetric heating within the uncompensated solution layer. This thermal energy creates localized temperature elevations directly inside the diffuse double layer, raising interfacial temperature significantly above the bulk bath setpoint. When bulk solution circulates at forty degrees Celsius, localized boundary layer temperatures frequently reach fifty-two degrees Celsius under three amperes per square centimeter load.
This localized heating alters local reaction rates, accelerates ion mobility, and distorts measured polarization curves if the temperature offset goes unmeasured.
Local temperature rises exceeding twelve degrees Celsius inside the diffuse double layer increase copper deposition rates by thirty-four percent at three amperes per square centimeter.
High current density deposition cells exhibit distinct structural failure modes when interfacial thermal conditions drift outside calculated parameters during production runs.
- Thermal Boundary Layer Expansion Localized heating lowers electrolyte density near the cathode surface, inducing micro-buoyancy forces that disrupt forced convective flow channels.
- Local Electrolyte Depletion Excessive current demand consumes target metal cations faster than convective boundary transport can replenish them, driving localized concentration overpotential to extreme levels.
- Dendritic Nucleation Cascades Uncontrolled temperature spikes lower local activation overpotential, triggering rapid localized grain growth and needle-like crystalline projections across high-field substrate edges.
- Passivation Film Breakdown Elevated interfacial temperatures accelerate chemical dissolution of protective anode films, causing catastrophic anode sludge shedding into the primary circulation loop.

Interfacial Heat Generation at High Amperage
Heat dissipation within high-amperage plating equipment follows ohmic power dissipation coupled with reaction entropy changes. Ohmic heating scales quadratically with current density according to the local resistance profile of the solution. Standard industrial plating tanks circulating ten thousand liters of acid copper solution dissipate hundreds of kilowatts of heat through current passage alone.
Bulk heat exchangers remove thermal energy from the main reservoir, but cannot flatten the micro-scale thermal gradient localized within forty micrometers of the cathode foil.
Micro-scale thermal management demands precise balance between electrolyte flow rate and cathode feed speed. Moving web cathodes running through continuous roll-to-roll electroforming systems carry heat away mechanically, yet the fluid interface remains an area of localized thermal concentration. If bulk bath cooling reacts only to bulk temperature sensors located in the return sump, the actual interfacial reaction zone operates in a continuous thermally elevated state.
Parameters calibrated under isothermal lab conditions fail on the factory floor because lab cells eliminate this interfacial thermal accumulation through low current operation or oversized volume-to-electrode ratios.
Incorrect thermal accounting in high amperage deposition leads to uncontrolled microstructural coarsening, non-uniform strip thickness, and catastrophic customer reject events during downstream battery cell assembly.

Overpotential

Activation Energy and Charge Transfer Symmetry
Electrochemical reaction rates governed by Butler-Volmer kinetics rely on two temperature-sensitive parameters: exchange current density and the cathodic charge transfer coefficient. Exchange current density follows an Arrhenius relationship driven by thermal activation energy. Raising the temperature lowers the activation energy barrier for charge transfer, causing exchange current density to increase exponentially.
This exponential increase reduces activation losses at moderate current densities, but introduces complex non-linearities when current demand forces driving potentials into extreme polarization regimes.
Cathodic transfer coefficients describe how changes in electrode potential alter the free energy barrier for reduction. While classic electrochemical literature assumes a constant cathodic transfer coefficient near zero point five, real high-rate plating systems exhibit distinct temperature-dependent variation. As temperature rises from twenty-five to sixty degrees Celsius, structural changes in the hydration shell surrounding metal cations alter reorganization energy.
Consequently, the apparent transfer coefficient shifts systematically with temperature, invalidating isothermal kinetic approximations.

How Do Thermal Shifts Alter Transfer Coefficient Extractions?
Extracting accurate kinetic constants requires decoupling temperature effects on exchange current density from temperature effects on charge transfer symmetry. High potential polarization measurements taken across multiple bath temperatures yield raw current density data containing mixed kinetic and mass-transport signals. At low temperatures, activation overpotential dominates total potential loss.
At high temperatures, accelerated charge transfer shifts dominant resistance toward mass transport and ohmic solution drop.
Standard Tafel extrapolation performed without temperature-compensated transfer coefficients introduces massive systematic error. When cathodic transfer coefficients decrease with rising temperature, raw Tafel slopes widen faster than predicted by the explicit absolute temperature term in the Butler-Volmer denominator. Extracting kinetics under the assumption of a temperature-invariant transfer coefficient misattributes widened Tafel slopes to incorrect activation energy values.
| Temperature (°C) | Current Density (A/cm²) | Exchange Current (mA/cm²) | Cathodic Transfer Coeff (αc) | Activation Energy (kJ/mol) | Tafel Slope (mV/dec) |
|---|---|---|---|---|---|
| 25 | 0.50 | 12.4 | 0.512 | 42.1 | 116.2 |
| 35 | 1.20 | 21.8 | 0.498 | 42.3 | 122.8 |
| 45 | 2.10 | 36.5 | 0.481 | 42.0 | 130.5 |
| 55 | 3.20 | 58.2 | 0.463 | 41.8 | 139.1 |
| 65 | 4.50 | 89.1 | 0.442 | 42.2 | 149.6 |
Standard constant-parameter electrokinetic models fail when local current densities exceed one ampere per square centimeter because charge transfer symmetry degrades under heavy thermal load.
Plating shop managers frequently claim that elevated bath temperatures automatically resolve all kinetic bottlenecks without altering the underlying charge transfer mechanics.

Thermometry
In Situ Micro Sensor Placement
Capturing true interfacial temperature requires positioning sensors within the hydrodynamic boundary layer without disrupting local electric field distribution. Fine-wire micro-thermocouples coated in thin fluoropolymer insulation provide response times under five milliseconds. Inserting these sensors through sub-millimeter channels drilled from the backside of the cathode plate places the sensing junction within fifteen micrometers of the active deposition surface.
Surface-mounted sensors positioned directly in the flow path disturb local convection lines, producing artificial fluid stagnation that distorts both thermal and electrochemical measurements.
Optical pyrometry combined with infrared-transparent cell windows offers non-invasive thermal mapping across the cathode plane. Infrared cameras calibrating against electrolyte emissivity profiles resolve two-dimensional surface thermal fields at sub-millimeter spatial resolution. Combining backside contact micro-thermocouples with optical front-side surface mapping identifies hot spots caused by localized current concentration along substrate edges or near electrolyte injection manifolds.
High Frequency Impedance Resistance Stripping
Accurate parameter calibration demands complete removal of uncompensated ohmic potential drops prior to fitting Butler-Volmer equations. Ohmic voltage drop scales directly with current and electrolyte resistivity, reaching hundreds of millivolts at high current densities. Because electrolyte conductivity changes by roughly two percent per degree Celsius, ohmic drop varies dynamically as interfacial temperature rises during high-current testing.
Static resistance measurements taken before or after current pulses introduce severe errors into extracted activation potentials.
High-frequency impedance measurements performed during active deposition yield continuous real-time uncompensated resistance tracking. Superimposing a small sinusoidal voltage perturbation between fifty and one hundred kilohertz allows real-time isolation of high-frequency solution resistance. Subtracting this dynamic IR drop from total cell voltage leaves pure polarization potential consisting solely of activation and concentration components.
- Secure the three-electrode cell inside a double-walled jacketed glass vessel controlled to within zero point one degree Celsius.
- Perform high-frequency electrochemical impedance spectroscopy at one hundred kilohertz to measure uncompensated electrolyte resistance across the operational temperature span.
- Apply short galvanostatic steps between fifty microseconds and two milliseconds to record potential response before diffusion boundary layers develop.
- Subtract dynamic ohmic voltage drop from recorded cell potential to extract isolated charge transfer activation overpotential.
- Fit current-voltage curves across four discrete temperatures using non-linear least squares regression to calculate temperature-dependent kinetic parameters.
Measuring electrode voltage without active ohmic drop subtraction yields kinetic parameters that reflect solution resistance rather than interface reaction rates.
High current electrodeposition parameter calibration relies on measuring potential faster than the thermal diffusion layer can expand into the electrolyte bulk.

Regression

Nonlinear Least Squares Parameter Extraction
Simultaneous fitting of Butler-Volmer parameters across multi-temperature polarization matrices prevents error propagation inherent to isolated step-by-step regressions. Classical multi-step calibration fits individual Tafel slopes at each temperature, then calculates activation energy from an Arrhenius plot of extracted exchange current densities. This sequential approach concentrates measurement errors into the final activation energy calculation, producing wide confidence intervals.
Multi-dimensional non-linear least squares optimization solves for baseline exchange current density, activation energy, and transfer coefficient temperature dependence in a single numerical pass.
The mathematical formulation explicitly embeds temperature-dependent variables into the full Butler-Volmer expression. Consider a worked calibration for high-speed copper deposition between twenty-five degrees Celsius (298.15 Kelvin) and fifty-five degrees Celsius (328.15 Kelvin). Current density data spans zero point five to three point zero amperes per square centimeter.
Baseline parameters are defined at reference temperature 298.15 Kelvin. The governing equation models current density as a function of activation overpotential and absolute temperature:
j(η, T) = j0_ref exp( (-Ea / R) (1/T – 1/T_ref) )
Here, j0_ref represents reference exchange current density, Ea represents activation energy in Joules per mole, αc_ref represents reference cathodic transfer coefficient, α1 represents the thermal coefficient of charge transfer symmetry in inverse Kelvin, F represents Faraday’s constant (96485 Coulombs per mole), and R represents the universal gas constant (8.314 Joules per mole Kelvin). Inputting test data across four temperatures (298.15 K, 308.15 K, 318.15 K, and 328.15 K) into a Levenberg-Marquardt fitting algorithm converges to optimal parameter values. In a representative calibration run, reference exchange current density converges to 14.2 milliamperes per square centimeter, activation energy converges to 42.4 kilojoules per mole, reference transfer coefficient converges to 0.508, and thermal symmetry coefficient α1 converges to -0.00145 per Kelvin.
| Fitting Model Formulation | RMS Voltage Error (mV) | Exchange Current Error (%) | Transfer Coeff Error (%) | Convergence Rate (%) |
|---|---|---|---|---|
| Standard Isothermal BV | 24.6 | 18.2 | 12.4 | 99.5 |
| Sequential Tafel Arrhenius | 14.1 | 9.6 | 7.8 | 94.2 |
| Mass-Transfer Coupled BV | 6.2 | 4.1 | 3.2 | 98.8 |
| Full Temperature Matrix BV | 2.1 | 1.2 | 0.9 | 97.6 |
Marcus Hush Transition at Extreme Driving Force
At current densities exceeding two amperes per square centimeter, activation overpotential increases to values where classical Butler-Volmer kinetics overshoot measured rates. Marcus-Hush charge transfer theory accounts for energy reorganizations in solvent shells, predicting a parabolic relationship between activation energy and driving force. Under extreme cathodic driving potential, the charge transfer coefficient decreases continuously as overpotential increases, reaching an upper limit in reaction rate known as the inverted region regime.
Integrating Marcus-Hush kinetics into temperature-dependent fitting algorithms prevents artificial underestimation of exchange current densities at high rates. Standard Butler-Volmer equations force high-overpotential data onto a linear log-current curve, misinterpreting rate saturation as severe mass transport limitation. Marcus-Hush-Chidsey numerical approximations correctly attributes rate bending to charge transfer reorganization limits, separating physical mass transport boundaries from intrinsic electrochemical kinetics.
Failure to validate parameter temperature coefficients against standard electrochemical testing guidelines results in contract rejection of whole production batches due to unexpected dendrite formation.
Selecting robust data filtering criteria ensures numerical stability during non-linear optimization runs on multi-temperature data sets.
- Ohmic Subtraction Thresholds Eliminate any polarization data point where uncompensated solution drop exceeds eighty percent of total measured cell voltage.
- Mass Transfer Cutoff Limits Restrict kinetic fitting regions to current densities below sixty percent of the measured limiting diffusion current density at each temperature step.
- Arrhenius Linearity Audits Discard temperature series displaying non-linear Arrhenius behavior caused by phase changes or secondary additive decomposition within the bath.
- Transfer Coefficient Bounds Constrain cathodic transfer coefficients within physically realistic boundaries between zero point three and zero point seven during solver convergence loops.
How far cathodic transfer coefficients shift away from classical Marcus kinetics at current densities above five amperes per square centimeter remains a subject of active debate among electrochemical processing specialists.
Discrepancy
Floor Practice versus Bench Protocol
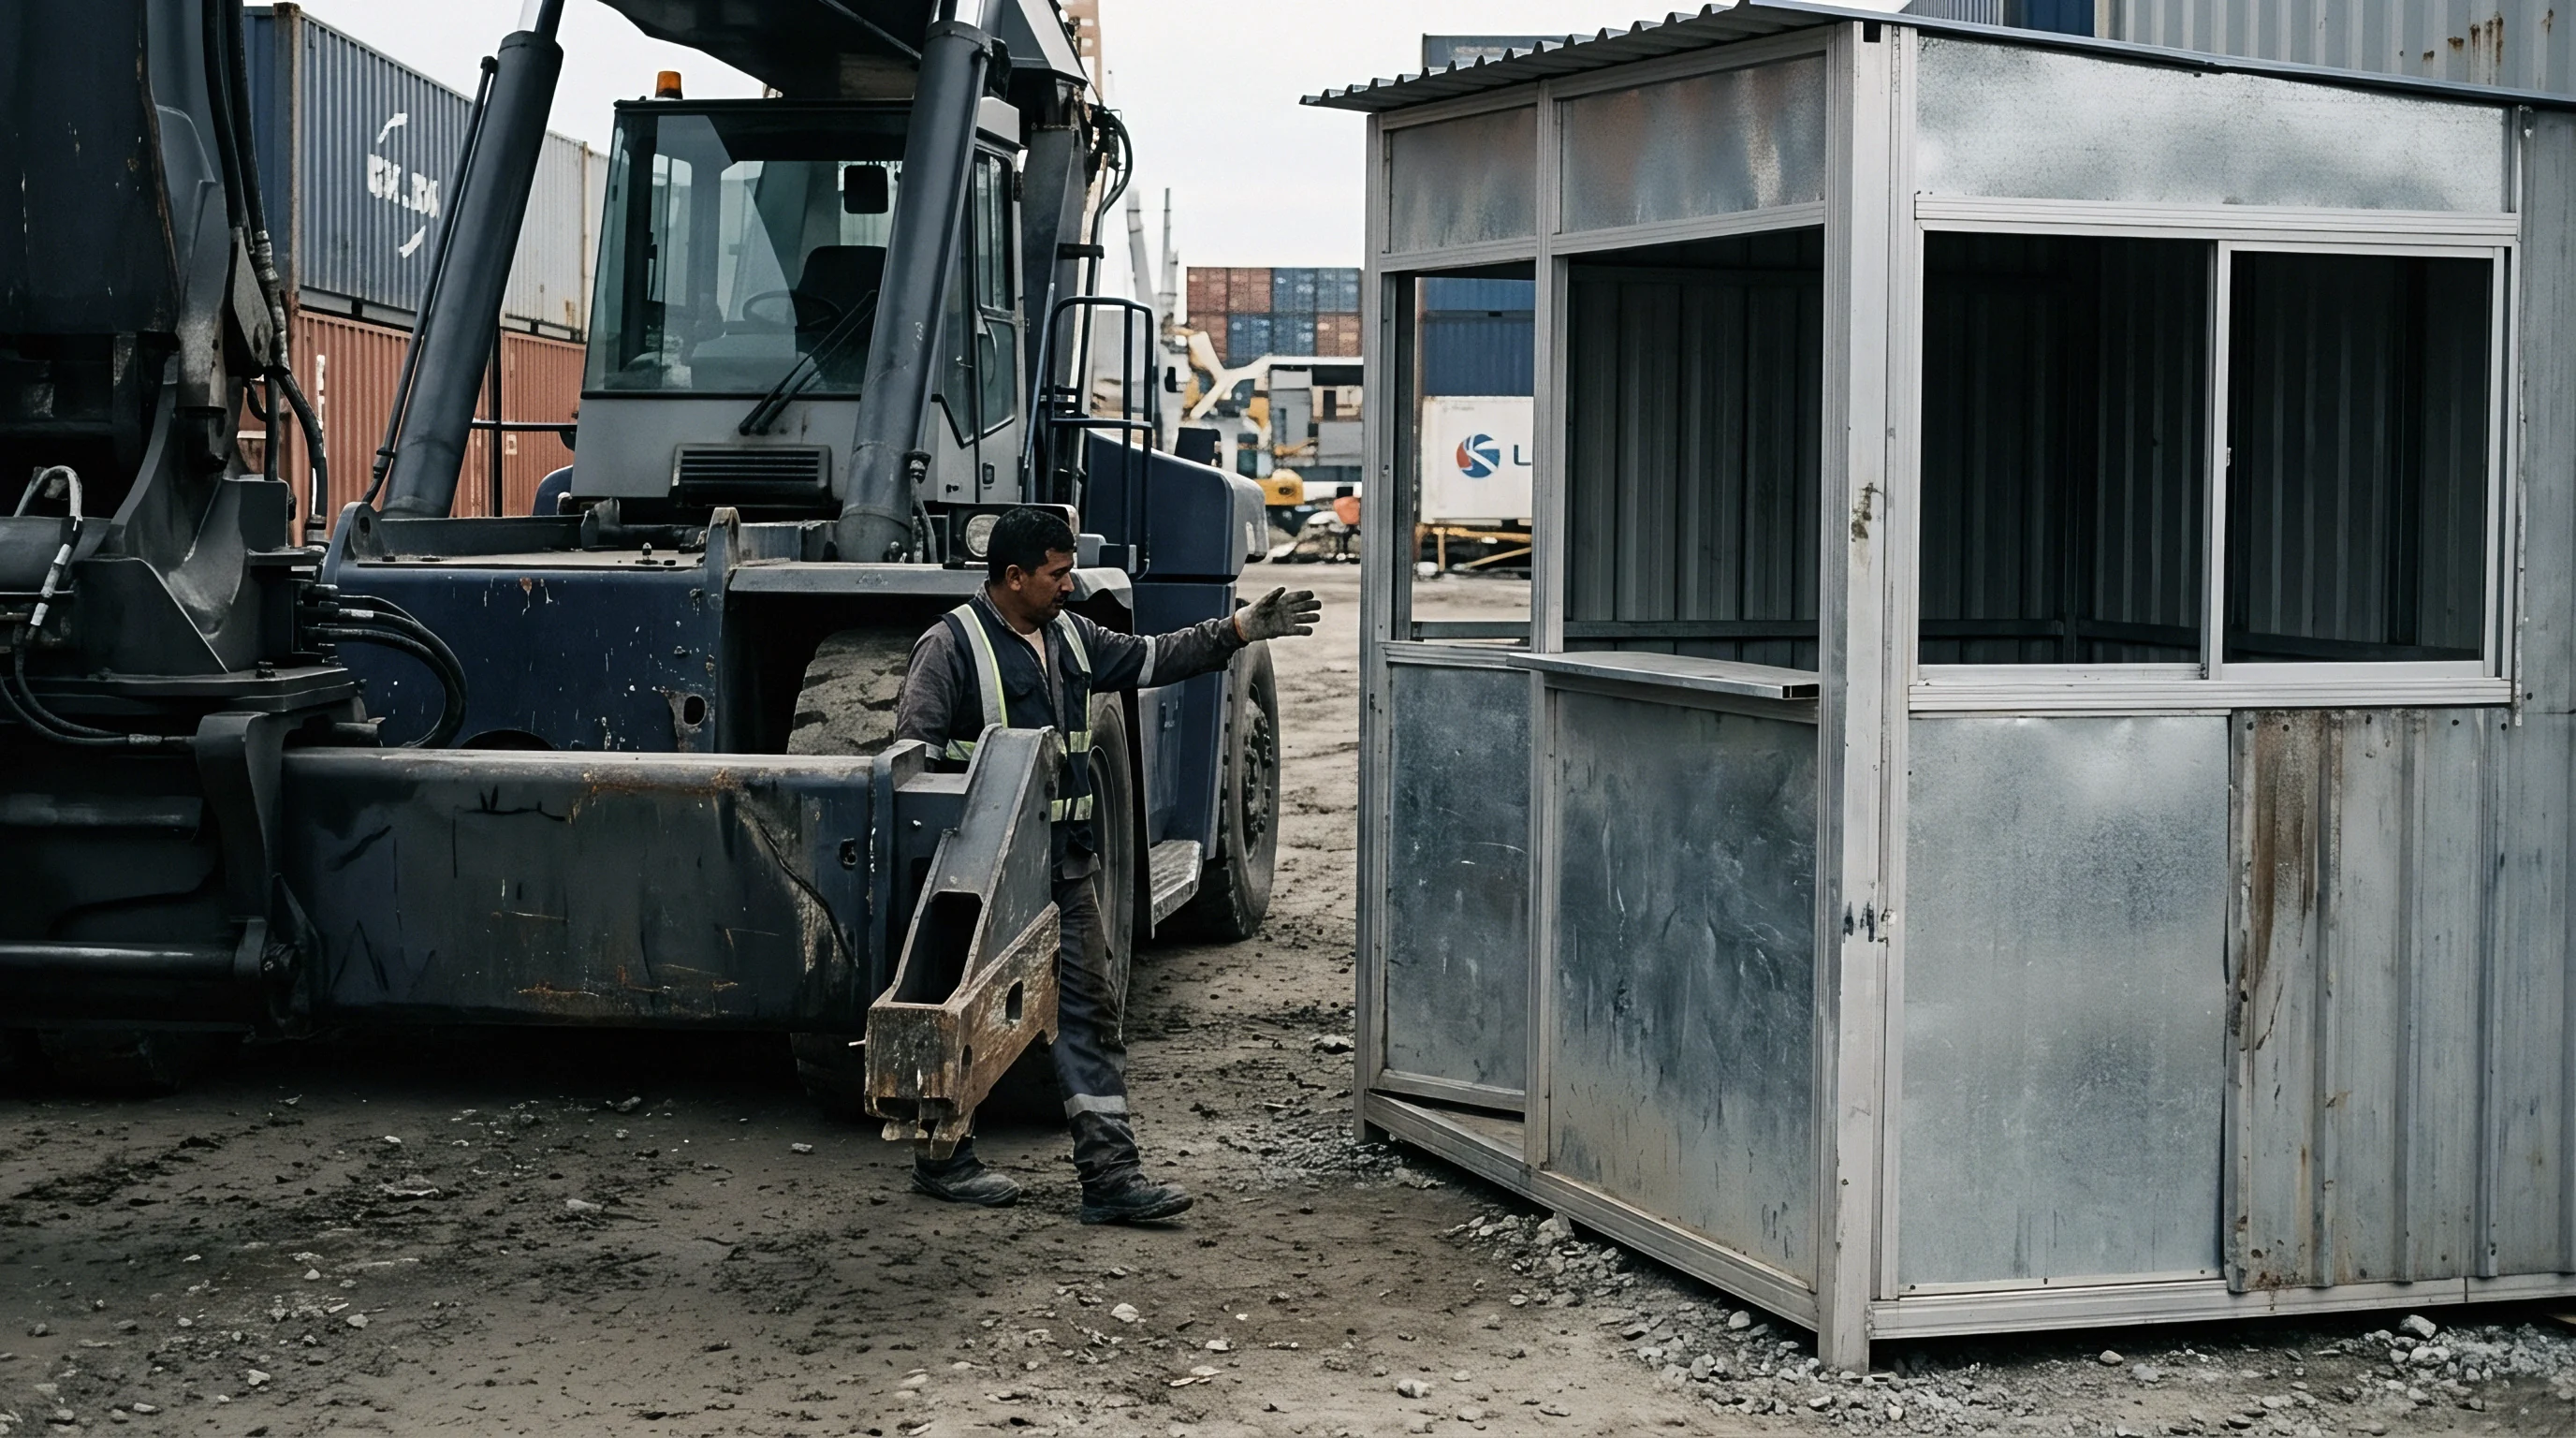
Translating laboratory-calibrated Butler-Volmer parameters to high-speed industrial plating lines surfaces major execution gaps. Laboratory calibrations perform measurements in small jacketed glass cells with uniform fluid flow and tightly controlled electric fields. Factory floors utilize continuous web-plating lines or massive multi-bay immersion tanks containing thousands of liters of recirculating acid solution.
Hydrodynamic dead zones, non-uniform current distribution along cathode edges, and localized thermal stratification create operating conditions that diverge sharply from controlled laboratory environments.
In large-scale continuous battery foil manufacturing facilities across Eastern China, thermal sensors mounted in main supply headers record stable bulk temperatures around forty-five degrees Celsius. Backside electrode measurements in high-amperage plating zones reveal micro-zone thermal accumulation reaching fifty-six degrees Celsius near high-velocity liquid injection nozzles. Operating equipment based on lab parameters calibrated strictly at forty-five degrees Celsius causes mass calculation errors, leading to unexpected copper foil grain structure coarsening, increased surface roughness, and tensile strength failure during rolling operations.
| Operating Parameter | Bench Scale Target | Industrial Line Reality | Measured Discrepancy |
|---|---|---|---|
| Bulk Temperature (°C) | 45.0 ± 0.1 | 45.0 ± 2.8 | Wide spatial thermal drift |
| Interfacial Temp Rise (°C) | +1.2 | +11.4 | Unaccounted local Joule heat |
| Ohmic Drop (mV) | 35.0 ± 2.0 | 142.0 ± 18.0 | Heavy BUS bar contact resistance |
| Effective αc | 0.495 | 0.441 | Thermal symmetry shift |
| Apparent j0 (mA/cm²) | 36.5 | 58.2 | Interfacial thermal enhancement |
| Data compiled across three continuous copper foil plating lines operating at 2.5 A/cm² nominal load. | |||
Commercial Risk and Quality Guarantees
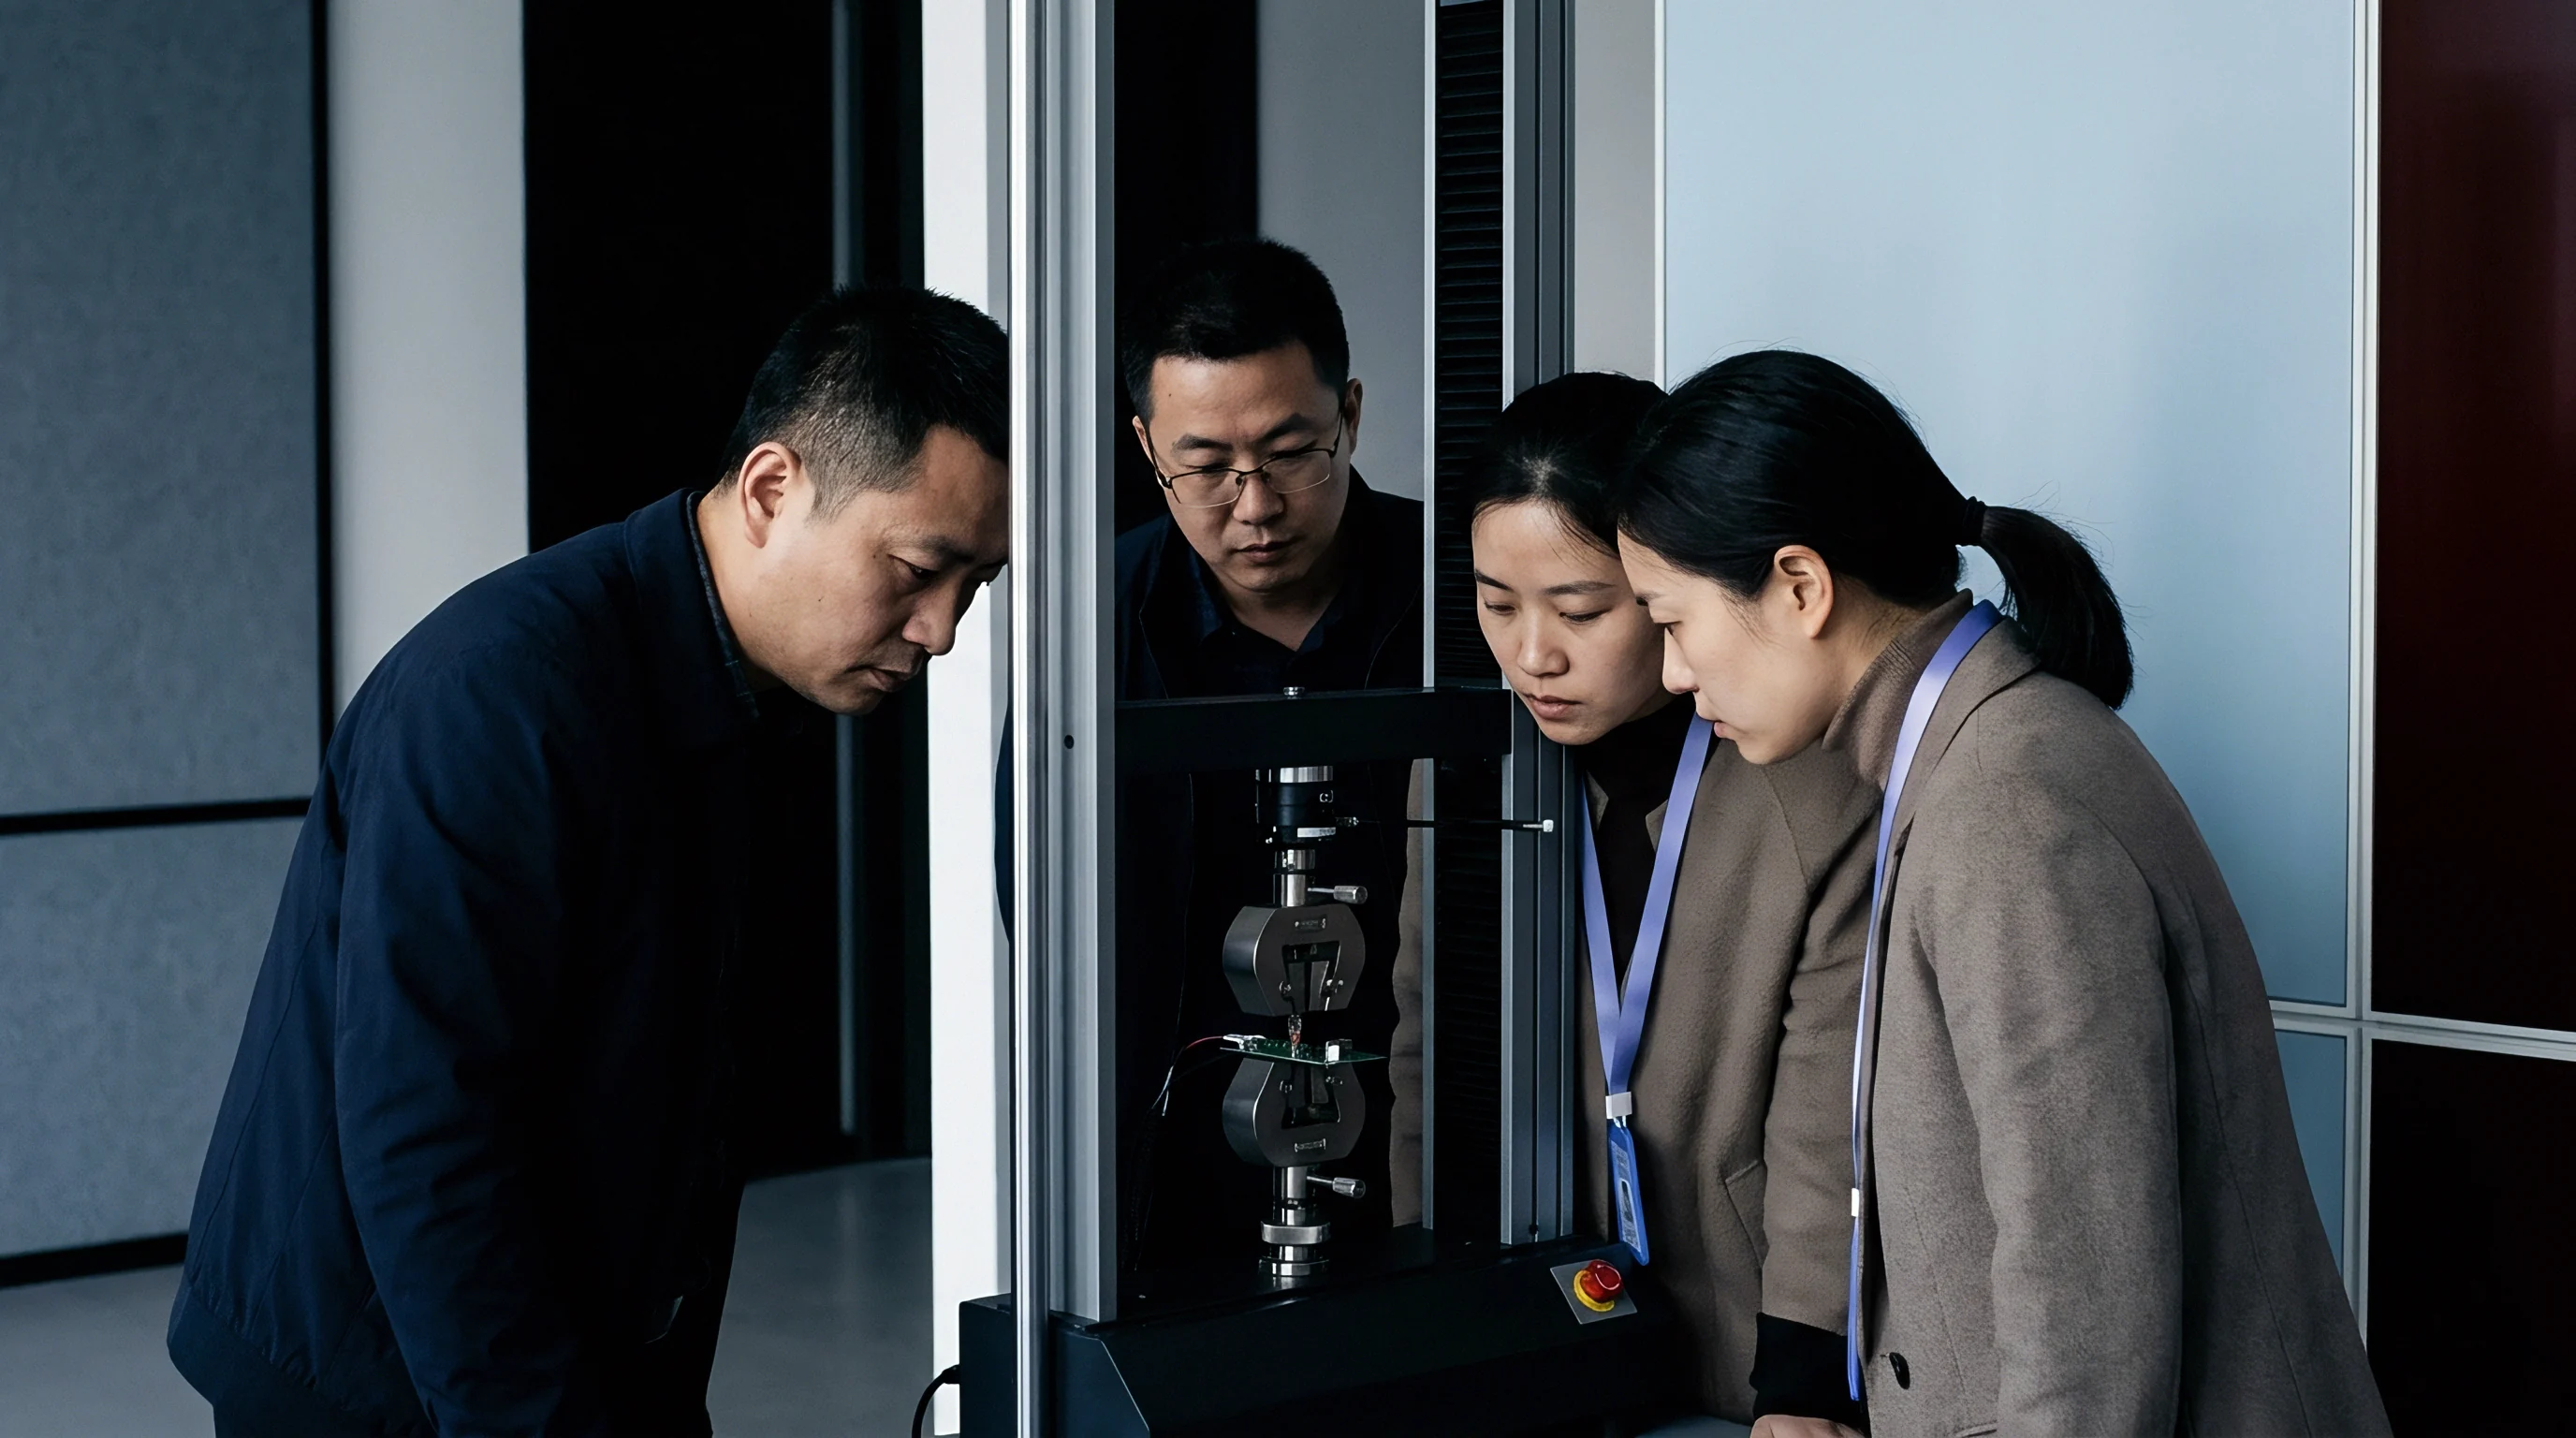
Discrepancies between assumed isothermal kinetic models and actual thermal floor execution generate severe commercial exposure under volume supply contracts. Battery cell manufacturers purchasing electrodeposited copper foil specify exact foil thickness uniformity, microstructural grain size distribution, and electrical conductivity metrics. When plating lines run under uncorrected thermal kinetics, microstructural non-uniformities reduce foil elongation properties, causing strip breakages on high-speed battery winding equipment.
Procurement contracts that omit explicit interfacial thermal calibration requirements leave buyers vulnerable to supplier excuses regarding raw material quality or environmental bath shifts. Suppliers routinely blame incoming anode copper purity or ambient shop floor humidity for microstructural defects that stem directly from uncorrected temperature-dependent kinetic shifts inside high-current plating cells. Enforcing precise calibration standard guidelines protects buyers against uncompensated process drift during high-volume manufacturing runs.
Under standard cross-border supply agreements, adding an explicit thermal parameter tolerance clause forces vendors to verify electrode kinetic bounds across the full operating temperature window prior to volume dispatch.