Calculating Interfacial Vacancy Concentration Gradients along Electroplated Copper Barriers in High Density Chips
Calculating interfacial vacancy gradients along copper barriers requires solving coupled electromigration, stress, and thermal divergence equations to prevent premature voiding.


Boundary
In advanced packaging architectures, electroplated copper interconnects rely on refractory metal barrier stacks to keep copper from migrating into dielectric layers. Microbumps and redistribution lines in high-density three-dimensional integrated circuits frequently operate at current densities exceeding one megampere per square centimeter. The interface separating electroplated copper from refractory barriers ~ such as tantalum, tantalum nitride, titanium, or titanium nitride ~ is where electromigration failure and stress-induced voiding usually start.
Long before macroscopic structural damage becomes visible under standard scanning electron microscopy, rapid vacancy accumulation and atomic flux divergence along this narrow physical boundary have already dictated device operating lifetime.
Electrodeposition chemistry directly establishes the initial physical state of the copper barrier boundary. Acidic copper sulphate baths with organic additives ~ specifically suppressors, accelerators, and levelers ~ yield fine-grained polycrystalline copper deposits that carry non-equilibrium vacancy concentrations from the start. Polyethylene glycol suppressors adsorb on high-energy crystal faces, while bis-3-sulfopropyl disulfide accelerators gather at grain boundaries and recessed features.
During post-plating thermal annealing between 150 and 250 degrees Celsius, grain growth occurs alongside organic residue decomposition. Sulphur, chlorine, and carbon species then segregate toward the barrier interface, creating localized vacancy traps and altering the interfacial self-diffusion activation energy.
Crystallographic texture in the copper adjacent to the barrier influences vacancy formation energetics. Deposit regions with a strong 111 crystal orientation parallel to the barrier plane exhibit higher interfacial binding energy than 200 oriented regions. Heterogeneous vacancy nucleation occurs preferentially at grain boundary junctions where microstructural misorientation intersects the refractory wall.
Thin-film barrier deposition ~ whether physical vapor deposition or atomic layer deposition ~ leaves residual stresses that can reach several hundred megapascals. On top of that, thermal expansion mismatch between copper (with a coefficient of thermal expansion near 16.5 parts per million per kelvin) and tantalum barriers (near 6.5 parts per million per kelvin) generates steep biaxial stress fields during thermal cycling.
Copper barrier interfaces containing sulphur impurity levels above 1.5 atomic percent display interfacial vacancy diffusion rates three times higher than pure interfaces under identical thermal aging conditions at 175 degrees Celsius.
Cross-sectional analysis of electroplated microbumps at an OSAT facility in Hsinchu shows the practical consequences of this boundary structure. Plating current density profiles during seed-layer fill govern the eventual distribution of vacancy traps. High current density plating accelerates deposition rates, but it leaves behind elevated point-defect concentrations within ten nanometers of the titanium seed layer.
Sub-nanometer voids often sit along the interface before any electrical stress is applied. These initial defect sites serve as boundary conditions when calculating interfacial vacancy concentration gradients during chip qualification.
Calculations of interfacial vacancy concentration gradients begin with finding the thermal equilibrium vacancy concentration. This value depends on the thermal vacancy formation energy and local hydrostatic stress state. Tensile stress lowers the energy necessary to form a vacancy, raising local equilibrium concentration above its stress-free baseline.
In microbump geometries where microstructural constraints prevent plastic relaxation, localized tensile stresses exceeding 200 megapascals elevate thermal equilibrium vacancy concentrations by more than an order of magnitude at nominal operating temperatures of 85 degrees Celsius.
Foundry engineering teams often attribute early electromigration failures to anomalous current crowding at line corners rather than interfacial impurity segregation. While plating bath additive balances may sit within normal operating bounds during wafer fabrication, interfacial defect densities can still diverge sharply from reference qualification samples. Attributing failures entirely to corner crowding turns attention away from microstructural segregation at the barrier wall and ignores how small shifts in additive breakdown products alter vacancy generation rates during backend processing.


Divergence
Atomic vacancy transport along electroplated copper barrier interfaces proceeds through coupled drift-diffusion mechanisms driven by electrical potential gradients, hydrostatic stress gradients, thermal gradients, and atomic concentration gradients. The total vacancy flux vector accounts for these simultaneous driving forces within the two-dimensional boundary layer. Calculating interfacial vacancy concentration gradients demands solving the continuous Nernst-Planck drift-diffusion framework adapted for interfacial boundary transport.

Driving Forces for Atomic Vacancy Migration
The total atomic vacancy flux along the interface incorporates four distinct transport terms. The concentration gradient term follows Fickian diffusion, moving vacancies from high concentration to low concentration. The electromigration term describes momentum transfer from conducting electrons to copper atoms, driving atomic motion in the direction of electron flow and sending an equal, opposite flux of vacancies toward the cathode interface.
Stress-assisted diffusion models vacancy migration toward regions of elevated hydrostatic tensile stress, where atomic volume expansion reduces system free energy. Finally, thermomigration captures vacancy drift induced by thermal gradients created by localized Joule heating within high-density chip interconnects.
| Mechanism | Driving Field | Coupling Coefficient | Primary Direction of Vacancy Movement |
|---|---|---|---|
| Electromigration Drift | Electric Field Intensity | Effective Charge Number | Toward Cathode Interface |
| Stress Gradient Migration | Hydrostatic Stress Gradient | Atomic Volume | Toward Tensile Stress Maxima |
| Thermomigration Drift | Temperature Gradient | Heat of Transport | Toward Higher Temperature Zones |
| Fickian Mass Diffusion | Concentration Gradient | Interfacial Diffusion Coefficient | Down Vacancy Gradient |
The mathematical formulation for total vacancy flux along the interface takes the following form in continuous spatial coordinates:
J_v = -D_v grad(C_v) + (D_v C_v / (k T)) Z_star q E + (D_v C_v / (k T)) Omega grad(sigma_h) + (D_v C_v / (k T^2)) Q_star grad(T)
In this governing equation, J_v represents the spatial vacancy flux vector along the interface, D_v represents the effective interfacial vacancy diffusion coefficient, C_v represents the local numerical vacancy concentration, k represents the Boltzmann constant, T represents absolute local temperature in kelvin, Z_star represents the effective charge number for electromigration, q represents elementary electron charge, E represents local electric field vector, Omega represents atomic volume of copper, sigma_h represents hydrostatic stress, and Q_star represents the heat of transport for thermomigration.

Boundary Conditions and Divergence Formulation
Mass conservation dictates that the local rate of vacancy accumulation equals the negative spatial divergence of total vacancy flux plus net vacancy generation or annihilation rates at interfacial defect sites. Microstructural interfaces act as semi-coherent boundary layers. Refractory metal barriers such as tantalum nitride present an impermeable barrier to copper atomic flux, establishing a zero-atomic-flux boundary condition perpendicular to the interface plane.
Void nucleation occurs when the local ratio of normalized vacancy concentration exceeds a critical thermodynamic threshold. Micro-voids coalesce once vacancy concentration reaches approximately ten to twenty times the thermal equilibrium value under localized tensile stress. The spatial divergence equation maps where atomic depletion creates structural micro-cavities along the copper line edge:
dC_v / dt = – div(J_v) + G_v – A_v
Here G_v represents local vacancy generation rate from dislocation climb and interfacial grain boundary relaxation, while A_v represents vacancy annihilation rate at microstructural sinks. Calculating vacancy flux divergence along the interface balances three driving fields across localized microbump geometry. Micro-void growth accelerates rapidly once local flux divergence transitions from negative to positive values along the barrier edge.
Interfacial diffusion coefficients in electroplated copper interconnects exceed grain boundary and bulk diffusion coefficients by two to three orders of magnitude. Activation energy for self-diffusion along an unpassivated or poorly adhering copper barrier interface ranges between 0.4 and 0.6 electronvolts, compared to 0.8 to 1.0 electronvolts for grain boundary diffusion and 1.2 electronvolts for bulk lattice diffusion. Chemical adhesion promoters like cobalt or ruthenium caps raise interfacial activation energy toward 0.9 electronvolts, suppressing interfacial atomic flux.
- Seed Layer Cleanliness Verification requires wet chemical etching protocols that clear native copper oxides without leaving chloride residues behind on the tantalum surface.
- Plating Current Profile Optimization uses multi-step current pulse waveforms to minimize initial non-equilibrium point-defect density within the boundary region.
- Post-Deposition Anneal Hold Times dictate the complete transformation of metastable grain structures into stable 111 textured matrices before barrier cap deposition.
- Barrier Sputter In-Situ Monitoring verifies that refractory film stoichiometry remains invariant across the entire wafer surface during production processing.
Current density spikes by factors of three to five at microbump entrance shoulders where copper redistribution lines narrow into vertical vias. This severe spatial non-uniformity in electric field intensity induces extreme localized electromigration flux divergence. Vacancies sweep toward the high-density corner, establishing steep interfacial vacancy concentration gradients over distances shorter than fifty nanometers.
Finite element calculations reveal that mechanical constraints imposed by low-k dielectric stacks produce sharp hydrostatic stress gradients precisely at the current crowding corner. Thermomigration acts in parallel when localized current density drives temperature variations exceeding twenty degrees Celsius across microbump dimensions. Interfacial diffusion dominates the lifetime kinetics under these multi-physics driving conditions.
JESD201 standards for environmental stress testing mandate that interfacial degradation models must account for stress-gradient-driven mass transport in advanced packaging interfaces.
Calculations of interfacial vacancy concentration gradients must account for temperature-dependent material property variation. As local temperature rises due to Joule heating, the effective interfacial diffusion coefficient increases exponentially following an Arrhenius relationship. Higher vacancy mobility accelerates both mass transport and the spatial redistribution of point defects along the barrier wall, accelerating the time required to reach critical void nucleation thresholds.
Measuring spatial gradient profiles provides early predictive capability for long-term chip reliability before micro-cracks propagate across the interconnect cross-section. Numerical solutions to the continuous divergence equations require precise knowledge of boundary parameters across operating temperature ranges.

Microscopy
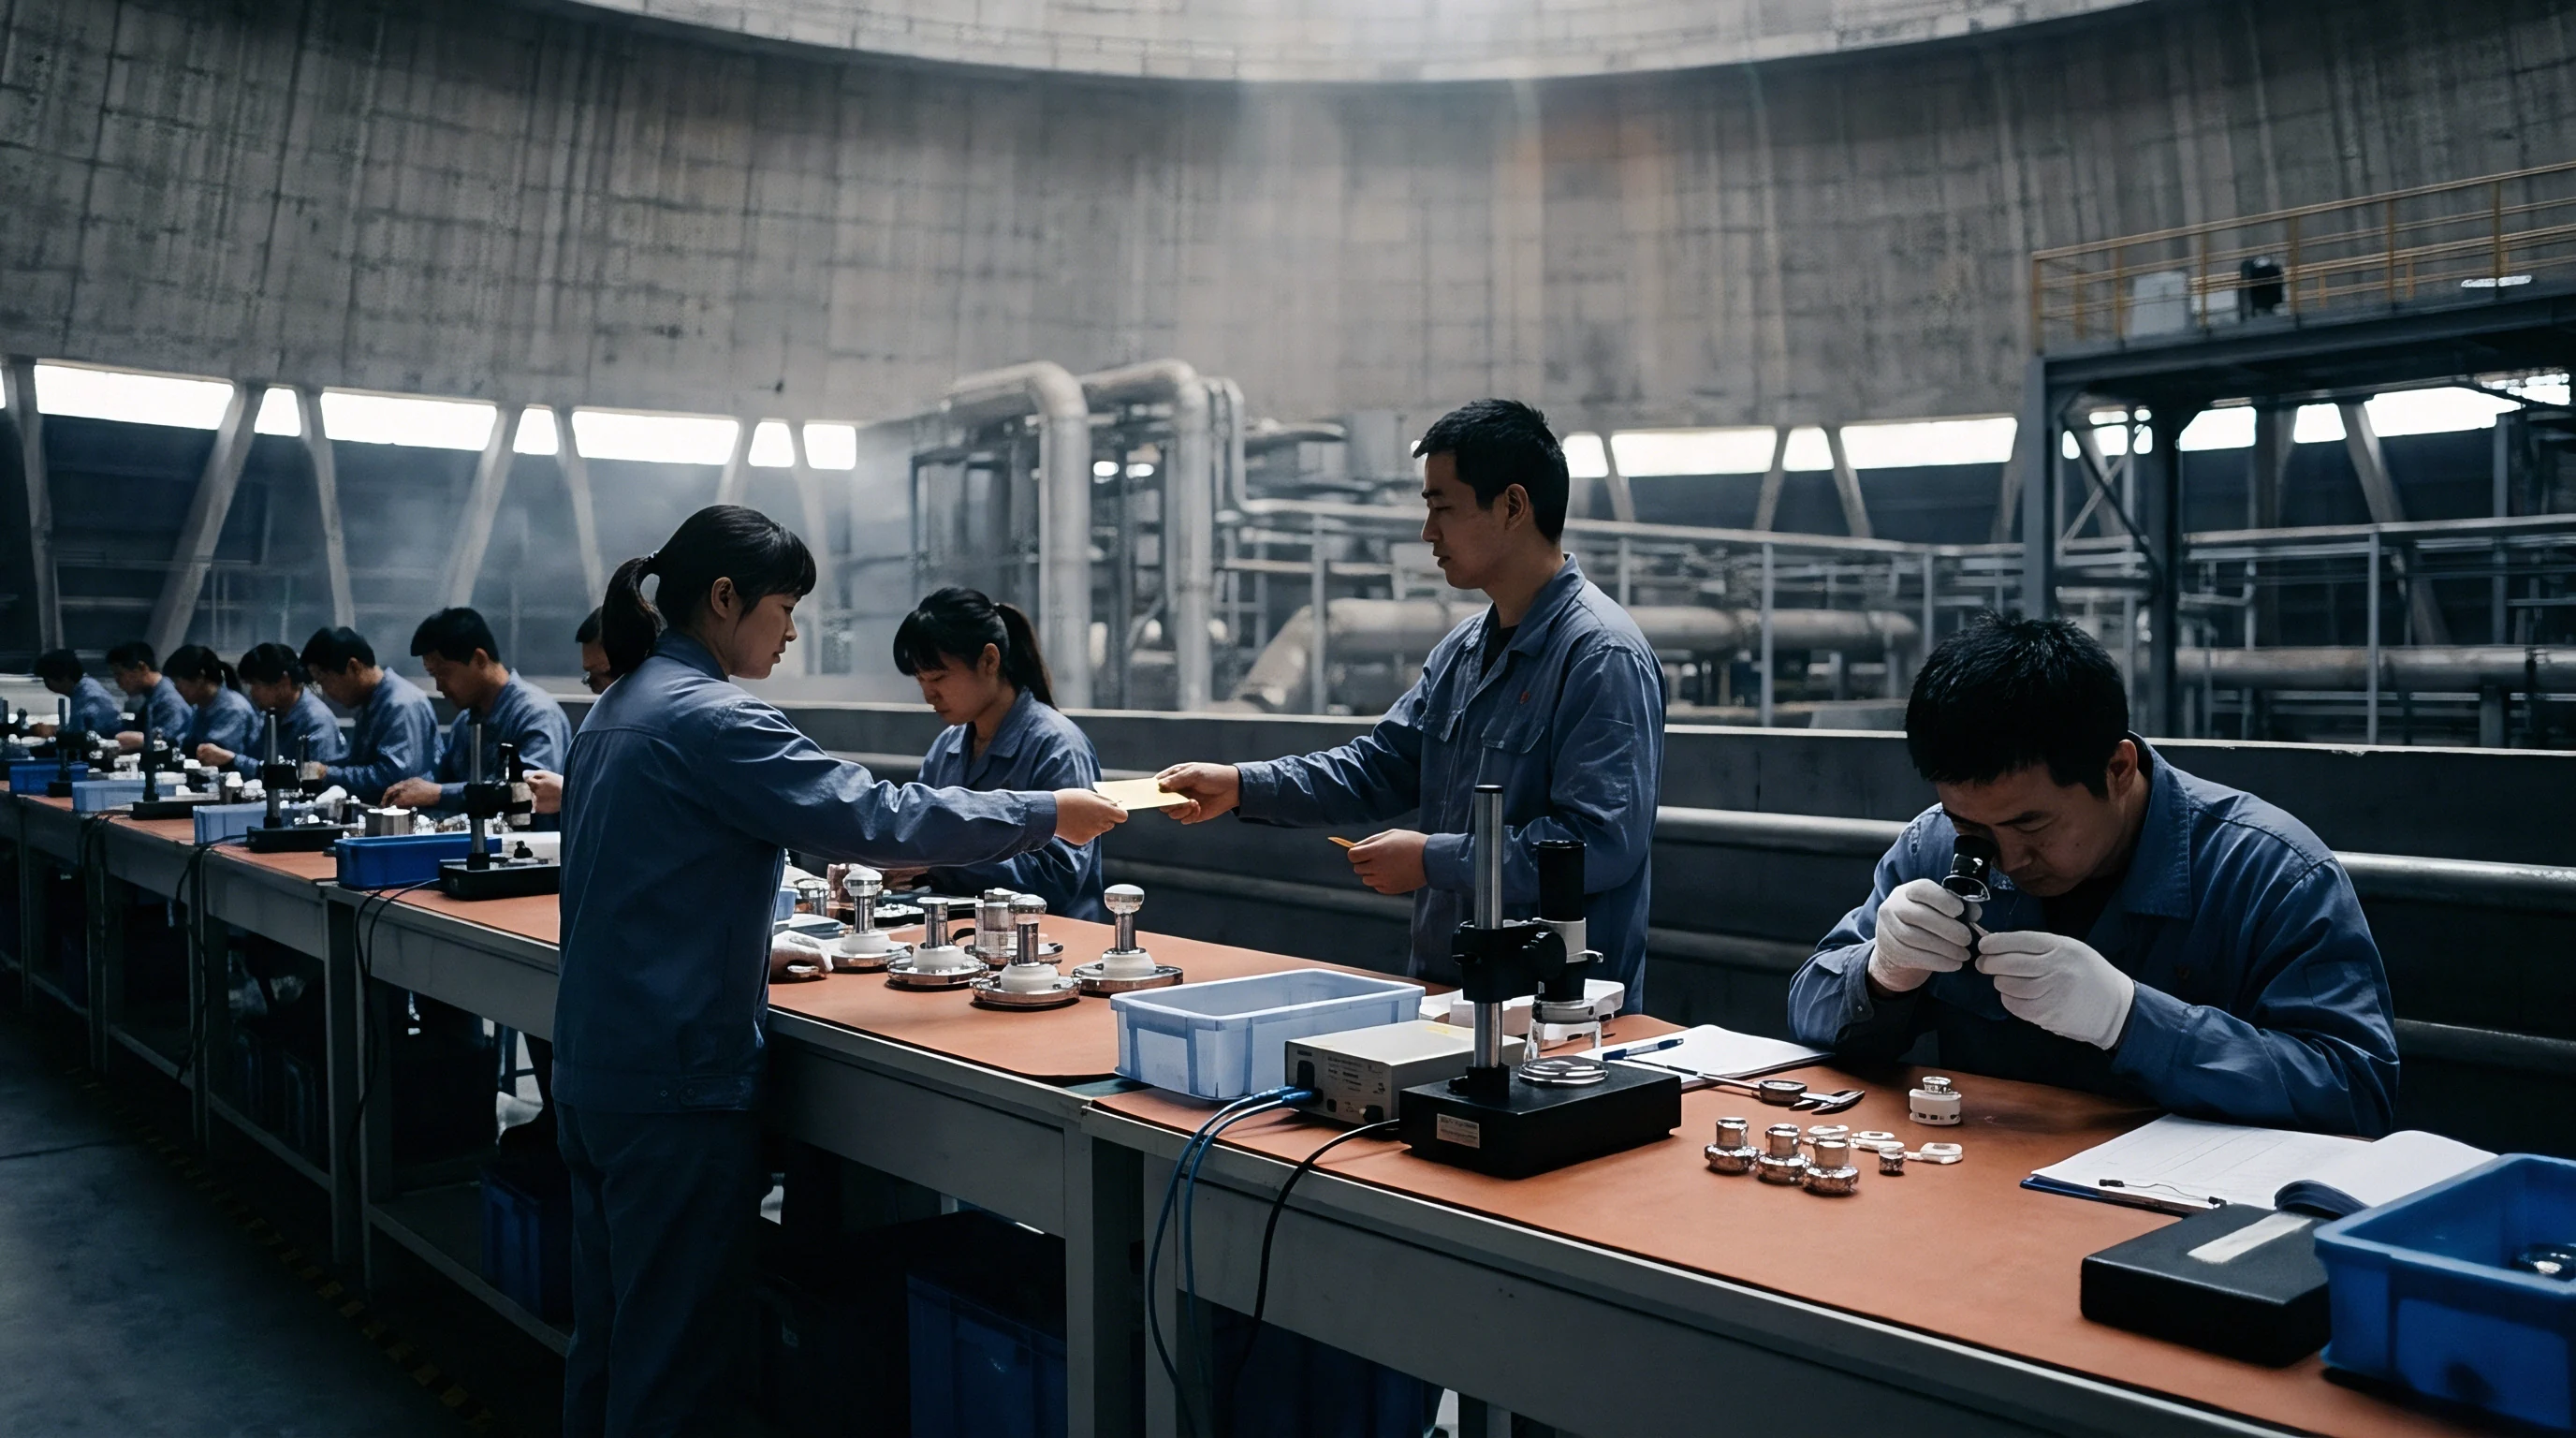
Analytical measurement of interfacial vacancy concentration gradients along electroplated copper barrier walls requires microstructural tools operating at sub-nanometer spatial resolution. Direct observation of atomic-scale vacancy distributions in embedded semiconductor interconnect structures presents severe analytical challenges. Physical characterization techniques combine electron energy loss spectroscopy, high-resolution transmission electron microscopy, high-sensitivity secondary ion mass spectrometry, and synchrotron micro-diffraction to resolve localized point defect states and strain fields near refractory barrier interfaces.

Advanced Characterization Protocols
Scanning transmission electron microscopy coupled with electron energy loss spectroscopy provides spatial mapping of local atomic density and chemical bonding state across the copper barrier interface. Fine structure analysis of the copper L-edge absorption spectrum reveals subtle shifts in local electronic state caused by localized lattice dilation surrounding vacancy complexes. By scanning a high-brightness probe beam across the interface in 0.2-nanometer increments, analytical tools reconstruct spatial profiles of vacancy-induced lattice parameter variations.
Time-of-flight secondary ion mass spectrometry maps chemical impurity distributions that anchor vacancy formation. Chlorine, sulphur, carbon, and oxygen trace elements gather within five nanometers of the tantalum interface. High impurity concentrations lower localized vacancy formation energy, producing spatial vacancy profiles that mirror the impurity concentration curve.
Calibrating secondary ion intensity signals against known ion-implanted reference standards permits quantitative extraction of localized contaminant profiles.
| Analytical Method | Spatial Resolution | Primary Measurement Target | Limit of Detection |
|---|---|---|---|
| STEM-EELS Density Mapping | 0.1 to 0.5 nanometers | Local electron density shift and lattice expansion | 0.5 atomic percent vacancy density equivalent |
| Synchrotron X-Ray Microdiffraction | 50 to 100 nanometers | Triaxial strain tensor and hydrostatic stress field | 5 times 10 to the minus 5 strain sensitivity |
| TOF-SIMS Depth Profiling | 1.0 to 3.0 nanometers depth | Interfacial additive and impurity segregation profiles | 1 part per million chemical concentration |
| High-Frequency Acoustic Microscopy | 1.0 to 5.0 micrometers | Sub-surface micro-void detection and delamination | 50 nanometer acoustic impedance alteration |
Synchrotron X-ray microdiffraction measures local crystallographic lattice strain fields with high strain resolution. Sub-micron focused X-ray beams raster across microbump barrier interfaces, collecting Laue diffraction patterns at each grid point. Software algorithms invert local Bragg peak shifts to calculate full triaxial strain tensors.
Hydrostatic stress calculated from these strain tensors feeds directly into vacancy concentration gradient calculations, establishing the stress-driven component of the thermodynamic driving force.
Acoustic microscopy provides non-destructive scanning capability for larger microbump arrays, detecting early stage interfacial delamination caused by vacancy condensation. High-frequency ultrasonic transducers operating above 300 megahertz resolve subtle changes in acoustic impedance when vacancy clusters coalesce into sub-surface nano-voids. Combining acoustic screening with focused ion beam cross-sectioning isolates degraded interfaces for detailed electron microscopy analysis.
Micro-void coalescence occurs when local vacancy concentration exceeds sixteen times thermal equilibrium baseline density under localized tensile stress exceeding 180 megapascals.
Sample preparation introduces artificial strain and defect states if performed incorrectly. Focused ion beam milling using gallium ions creates an amorphous surface layer up to twenty nanometers deep along cross-sectional cuts. This damaged layer alters local stress states and introduces artificial vacancy traps that corrupt electron energy loss spectroscopy measurements.
Low-energy argon ion polishing at beam energies below 500 electronvolts clears gallium-damaged surface layers, restoring true microstructural conditions for atomic-scale vacancy profiling.
Quantifying vacancy concentration gradients along electroplated copper barrier interfaces demands cross-calibrating spatial strain profiles against atomistic molecular dynamics simulations. Raw analytical signals represent convoluted structural responses containing grain boundary, impurity, and thermal strain components. Deconvoluting these signals requires subtracting thermal baseline strain measurements recorded on unstressed reference chips manufactured within the same wafer lot.
Distinguishing between pre-existing plating voids and vacancies generated by electromigration during accelerated life testing remains an ongoing operational challenge for failure analysis laboratories.

Validation
Validating calculated interfacial vacancy concentration gradients requires rigorous accelerated life testing routines linked to high-density chip qualification protocols. Electromigration test structures built into wafer scribe lines provide empirical time-to-failure data under elevated current densities and ambient temperatures. Black’s Equation modifications incorporate multi-physics vacancy divergence models to predict field failure rates at nominal operating conditions.

Accelerated Electromigration Testing Protocols
Wafer-level electromigration acceleration tests subject test structures to extreme electrical current densities ranging from two to ten megamperes per square centimeter at temperatures between 200 and 300 degrees Celsius. Rapid testing routines compress failure timelines from thousands of hours down to hours or minutes. Monitoring resistance drift during testing provides real-time tracking of interfacial void nucleation and growth kinetics.
Standard package-level electromigration testing follows JEDEC standard JESD61, running long-term stress tests across dozens of packaged devices inside high-temperature burn-in chambers. Devices operate at current densities between 0.5 and 1.5 megamperes per square centimeter at ambient temperatures of 125 to 150 degrees Celsius. Continuous precision resistance measurements record the precise timestamp of one percent, five percent, and ten percent resistance increases, establishing failure distribution statistics modeled using lognormal distributions.
Wafer-level electromigration acceleration conditions set to 175 degrees Celsius under a current density of 2.5 megamperes per square centimeter isolate interfacial vacancy drift while suppressing bulk lattice diffusion pathways that dominate above 300 degrees Celsius. Resistance drift signatures collected under these conditions match analytical predictions derived from continuous vacancy divergence equations.
Whether wafer-level electromigration acceleration reliably predicts interfacial vacancy accumulation remains a central consideration in accelerated testing program design.
Wafer-level acceleration methods offer rapid feedback for process control but introduce complex thermal gradient artifacts due to severe localized Joule heating. High current densities generate temperature spikes of 30 to 50 degrees Celsius along the test line center relative to wafer bond pads. Thermomigration flux components overwhelm electromigration flux components under these conditions, distorting measured failure times.
Extrapolating wafer-level test results to field operating conditions without correcting for thermomigration leads to inaccurate activation energy estimations.
- Package Level Burn-In Qualification operates under JESD22-A108 standards, applying steady thermal and electrical stress across 336 packaged units per lot.
- High Temperature Storage Life Verification isolates purely thermal vacancy generation mechanism by aging unpowered chips at 150 degrees Celsius for 1000 hours.
- Temperature Humidity Bias Testing evaluates moisture-assisted interfacial adhesion degradation under combined environmental and electrical stress fields.
- Wafer Level Resistance Drift Screening detects early physical void nucleation by recording micro-ohm resistance shifts during three-minute high-density electrical pulses.
Modifying Black’s Equation to include vacancy concentration gradient terms improves lifetime prediction accuracy for advanced high-density packages. Classical Black’s Equation models mean time to failure as a function of current density raised to an empirical exponent n and an activation energy term Q:
MTTF = A (J ^ (-n)) exp( Q / (k T) )
In advanced packaging architectures with barrier interfaces, activation energy Q varies non-linearly with localized vacancy concentration gradient build-up. Incorporating spatial vacancy flux divergence into the activation energy term yields a modified reliability equation:
MTTF_modified = A_0 (J ^ (-n)) exp( (Q_0 – Gamma grad(C_v)) / (k T) )
In this expression, Q_0 represents nominal interfacial self-diffusion activation energy, Gamma represents an empirical coupling factor linking vacancy gradients to activation energy reduction, and grad(C_v) represents maximum localized vacancy concentration gradient calculated at line corners.
Wafer fab cleanroom monitoring must track organic bath breakdown products down to parts-per-billion levels to maintain constant interfacial quality across production cycles, as segregated sulphur alters boundary transport. Similarly, failure to maintain uniform substrate cooling during accelerated testing introduces thermal gradient drift, producing false failure modes that invalidate qualification datasets.
Ignoring interfacial vacancy gradient corrections during package reliability modeling leads to overestimating interconnect lifetime by factors of four to eight in advanced 2.5D and 3D chip assemblies. The resulting field returns create severe financial liability, forcing expensive recall programs and damage to foundry commercial standing when high-density chips fail prematurely in high-reliability computing applications.


Numerics
Numerical modeling of interfacial vacancy concentration gradients relies on multi-physics finite element methods capable of solving fully coupled partial differential equations across complex three-dimensional interconnect geometries. Microbumps and redistribution lines exhibit sub-micron geometric features adjacent to millimeter-scale chip dimensions, demanding multi-scale spatial discretization and adaptive mesh refinement strategies near refractory barrier interfaces.

Finite Element Formulation and Mesh Discretization
Multi-physics solver routines construct weak formulations of coupled heat transfer, electrostatic, mechanical equilibrium, and mass transport equations. The solution routine proceeds sequentially or through fully coupled monolithic matrix schemes. Spatial discretization requires sub-nanometer element sizes along electroplated copper barrier walls to capture steep vacancy concentration gradients that form within twenty nanometers of the barrier plane.
Adaptive mesh refinement algorithms automatically increase node density in regions exhibiting elevated vacancy flux divergence. Structured boundary-layer meshes composed of ultra-thin prismatic elements line the interface, maintaining high aspect ratios aligned with atomic flux paths. Mesh convergence checks verify that calculated peak vacancy concentration values remain invariant when element dimensions drop below 0.5 nanometers along the interface normal vector.
| Physical Property | Symbol | Input Value | Units |
|---|---|---|---|
| Copper Interfacial Diffusion Activation Energy | Q_i | 0.52 | electronvolts |
| Pre-exponential Interfacial Diffusion Coefficient | D_0i | 1.5 times 10 to the minus 6 | square meters per second |
| Effective Charge Number for Electromigration | Z_star | -5.5 | dimensionless |
| Copper Atomic Volume | Omega | 1.18 times 10 to the minus 29 | cubic meters |
| Heat of Transport for Thermomigration | Q_star | 0.045 | electronvolts |
| Baseline Thermal Vacancy Formation Energy | E_f | 1.04 | electronvolts |
Boundary value problem definitions specify zero atomic flux through the impermeable refractory barrier wall. Microbump ends connecting to upper and lower metallization layers act as vacancy sinks or sources, where vacancy concentration resets to thermal equilibrium values or reflects continuous flux continuity across material interfaces. Initial conditions set normalized vacancy concentration to unity across the entire solution domain at time zero.

Worked Numerical Calculation: 2.5d Microbump Interface
Consider a representative 2.5D package microbump interconnect structure featuring an electroplated copper pillar with a diameter of 25 micrometers, capped with a 50-nanometer cobalt-tantalum-nitride barrier layer. The microbump carries a direct current of 0.35 amperes at a steady-state operating temperature of 105 degrees Celsius. Electrical simulation indicates a mean current density of 0.71 megamperes per square centimeter across the pillar cross-section, crowding to 2.85 megamperes per square centimeter at the sharp entrance corner.
The calculation sequence evaluates local driving fields and updates vacancy spatial distribution over a 500-hour operational stress period. The local electric field E at the current crowding corner reaches 420 volts per meter. Hydrostatic stress calculations indicate a peak tensile stress of 215 megapascals at the corner due to thermal expansion mismatch between the copper pillar and surrounding mold compound.
Temperature gradients produced by Joule heating equal 1.25 degrees Celsius per micrometer directed away from the corner.
Step one calculates the local thermal equilibrium vacancy concentration C_eq under tensile stress:
C_eq = C_0 exp( (sigma_h Omega) / (k T) )
Substituting input values (sigma_h = 215 MPa, Omega = 1.18e-29 m^3, T = 378.15 K, k = 1.38e-23 J/K):
sigma_h Omega = 2.15e8 1.18e-29 = 2.537e-21 Joules
k T = 1.38e-23 378.15 = 5.218e-21 Joules
C_eq / C_0 = exp( 2.537e-21 / 5.218e-21 ) = exp(0.4862) = 1.626
Tensile stress alone elevates equilibrium vacancy concentration by 62.6 percent above stress-free values at the corner interface.
Step two calculates the effective interfacial vacancy diffusion coefficient D_vi at 105 degrees Celsius (378.15 Kelvin):
D_vi = D_0i exp( -Q_i / (k T) )
Q_i = 0.52 eV = 8.33e-20 Joules
D_vi = (1.5e-6) exp( -8.33e-20 / 5.218e-21 ) = (1.5e-6) exp(-15.963) = 1.5e-6 1.167e-7 = 1.75e-13 m^2/s
Step three calculates the electromigration vacancy drift velocity v_EM along the interface:
v_EM = (D_vi / (k T)) Z_star q E
q = 1.602e-19 Coulombs, Z_star = -5.5, E = 420 V/m
v_EM = (1.75e-13 / 5.218e-21) (-5.5) (1.602e-19) 420 = (3.353e7) (-3.700e-16) = -1.241e-8 meters per second
Step four evaluates the spatial vacancy concentration gradient grad(C_v) formed after 500 hours of continuous stressing. Transient numerical integration of the divergence equation across a 100-nanometer grid segment adjacent to the corner yields a local normalized vacancy concentration C_v / C_0 of 14.8 at the corner node, decaying to 1.65 at a distance 80 nanometers along the barrier wall.
grad(C_v) = (14.8 – 1.65) / (80e-9 meters) = 13.15 / 80e-9 = 1.644e8 normalized concentration units per meter
This calculated spatial concentration gradient of 1.644 times 10 to the eighth per meter establishes an intense Fickian back-diffusion flux opposing electromigration drift. When back-diffusion balances electromigration drift, a steady-state vacancy gradient is established. If the peak vacancy ratio of 14.8 exceeds the void nucleation threshold of 12.0 for this specific interface, micro-voids nucleate at the microbump corner before steady-state balance can be maintained.
Void nucleation relieves localized tensile stress, altering local boundary conditions and causing adjacent spatial elements to re-equilibrate. The numerical solver updates spatial domain boundaries dynamically, tracking void growth interface advance across consecutive time steps.
Numerical simulation convergence depends strongly on time-step selection. Explicit time integration schemes demand sub-microsecond time steps to satisfy Courant-Friedrichs-Lewy stability criteria on ultra-fine boundary layer meshes. Implicit backward-Euler time integration schemes permit larger time steps while maintaining unconditional numerical stability during multi-hundred-hour transient stress simulations.
Stipulation
Managing cross-border semiconductor supply chains for advanced high-density packages demands translating complex microstructural physics into enforceable commercial contracts. Wafer foundries, outsourced semiconductor assembly and test vendors, and fabless design houses often dispute financial responsibility for electromigration failures. Converting calculated interfacial vacancy concentration gradients into explicit quality acceptance criteria protects buyers against latent reliability defects.
Commercial agreements must establish precise limits on electroplating bath purity, additive breakdown concentrations, and post-plating anneal thermal histories. Standard wafer manufacturing purchase orders that specify only sheet resistance and film thickness fail to cover interfacial defect densities. Specifying maximum allowable organic contaminant concentrations at refractory metal interfaces provides objective criteria for batch rejection prior to expensive packaging operations.
Commercial wafer procurement agreements require incorporating vacancy accumulation limits directly into batch delivery covenants. Contracts must detail analytical audit rights, permitting buyers to pull production wafers for destructive STEM-EELS and TOF-SIMS interfacial testing at independent laboratories. When analytical testing reveals interfacial impurity levels exceeding agreed limits, automatic cost allocation clauses transfer rework and scrap costs back to the wafer foundry.
| Interface Quality Metric | Standard Industry Specification | Strict Reliability Contract Stipulation | Financial Liability Trigger |
|---|---|---|---|
| Interfacial Sulphur Impurity | Not Measured (Process Controlled) | Less than 0.3 atomic percent at barrier wall | Full wafer lot debit and scrap reimbursement |
| Plating Additive Breakdown (TOC) | Less than 50 parts per million bath TOC | Less than 15 parts per million bath TOC | Foundry re-plating at zero buyer charge |
| Electromigration Acceleration MTTF | JESD61 Pass/Fail Baseline | MTTF greater than 2500 hours at 150°C, 1.0 MA/cm² | Packaging line stoppage and joint root-cause audit |
| Microbump Interfacial Void Density | Less than 1.0 percent area fraction | Zero micro-voids larger than 10 nanometers | 100 percent OSAT inspection cost penalty |
Fabless operations directors managing foundry suppliers across distance face significant communication barriers when technical failures occur. When weekly yield reports show elevated infant mortality during burn-in screening, failure analyses frequently single out assembly-level mechanical stress from OSAT mold compounds rather than fabrication defects. Having verified physical vacancy gradient calculations based on precise interfacial impurity profiles enables buyers to counter these assessments with physical evidence.
Retaining on-site packaging engineers at OSAT facilities in Hsinchu or Taichung costs between 8,000 and 12,000 dollars per month per line. This expenditure pays for itself by catching plating bath drift and post-plating anneal temperature deviations before thousands of processed wafers enter high-cost substrate assembly lines. A single prevented recall program for high-density server processors saves millions of dollars in field replacement liabilities and legal costs.
Formal supply agreements must embed technical parameters directly into warranty terms, defining exact mathematical procedures for calculating vacancy accumulation metrics during qualification.
Standard foundry delivery agreements shall specify that wafer lot acceptance remains contingent upon microbump interfacial vacancy concentration gradients remaining below 2.0 times 10 to the eighth normalized concentration units per meter under standard JESD61 accelerated test conditions, whereupon any lot exceeding this gradient threshold shall be debited against the foundry turnkey account at full replacement value.