Online Spectrometry Calibration and Matrix Correction in Substrate Copper Electroplating
Continuous optical absorption monitoring paired with multivariate matrix correction prevents plating voids and stabilizes copper thickness on advanced substrates.


Cell
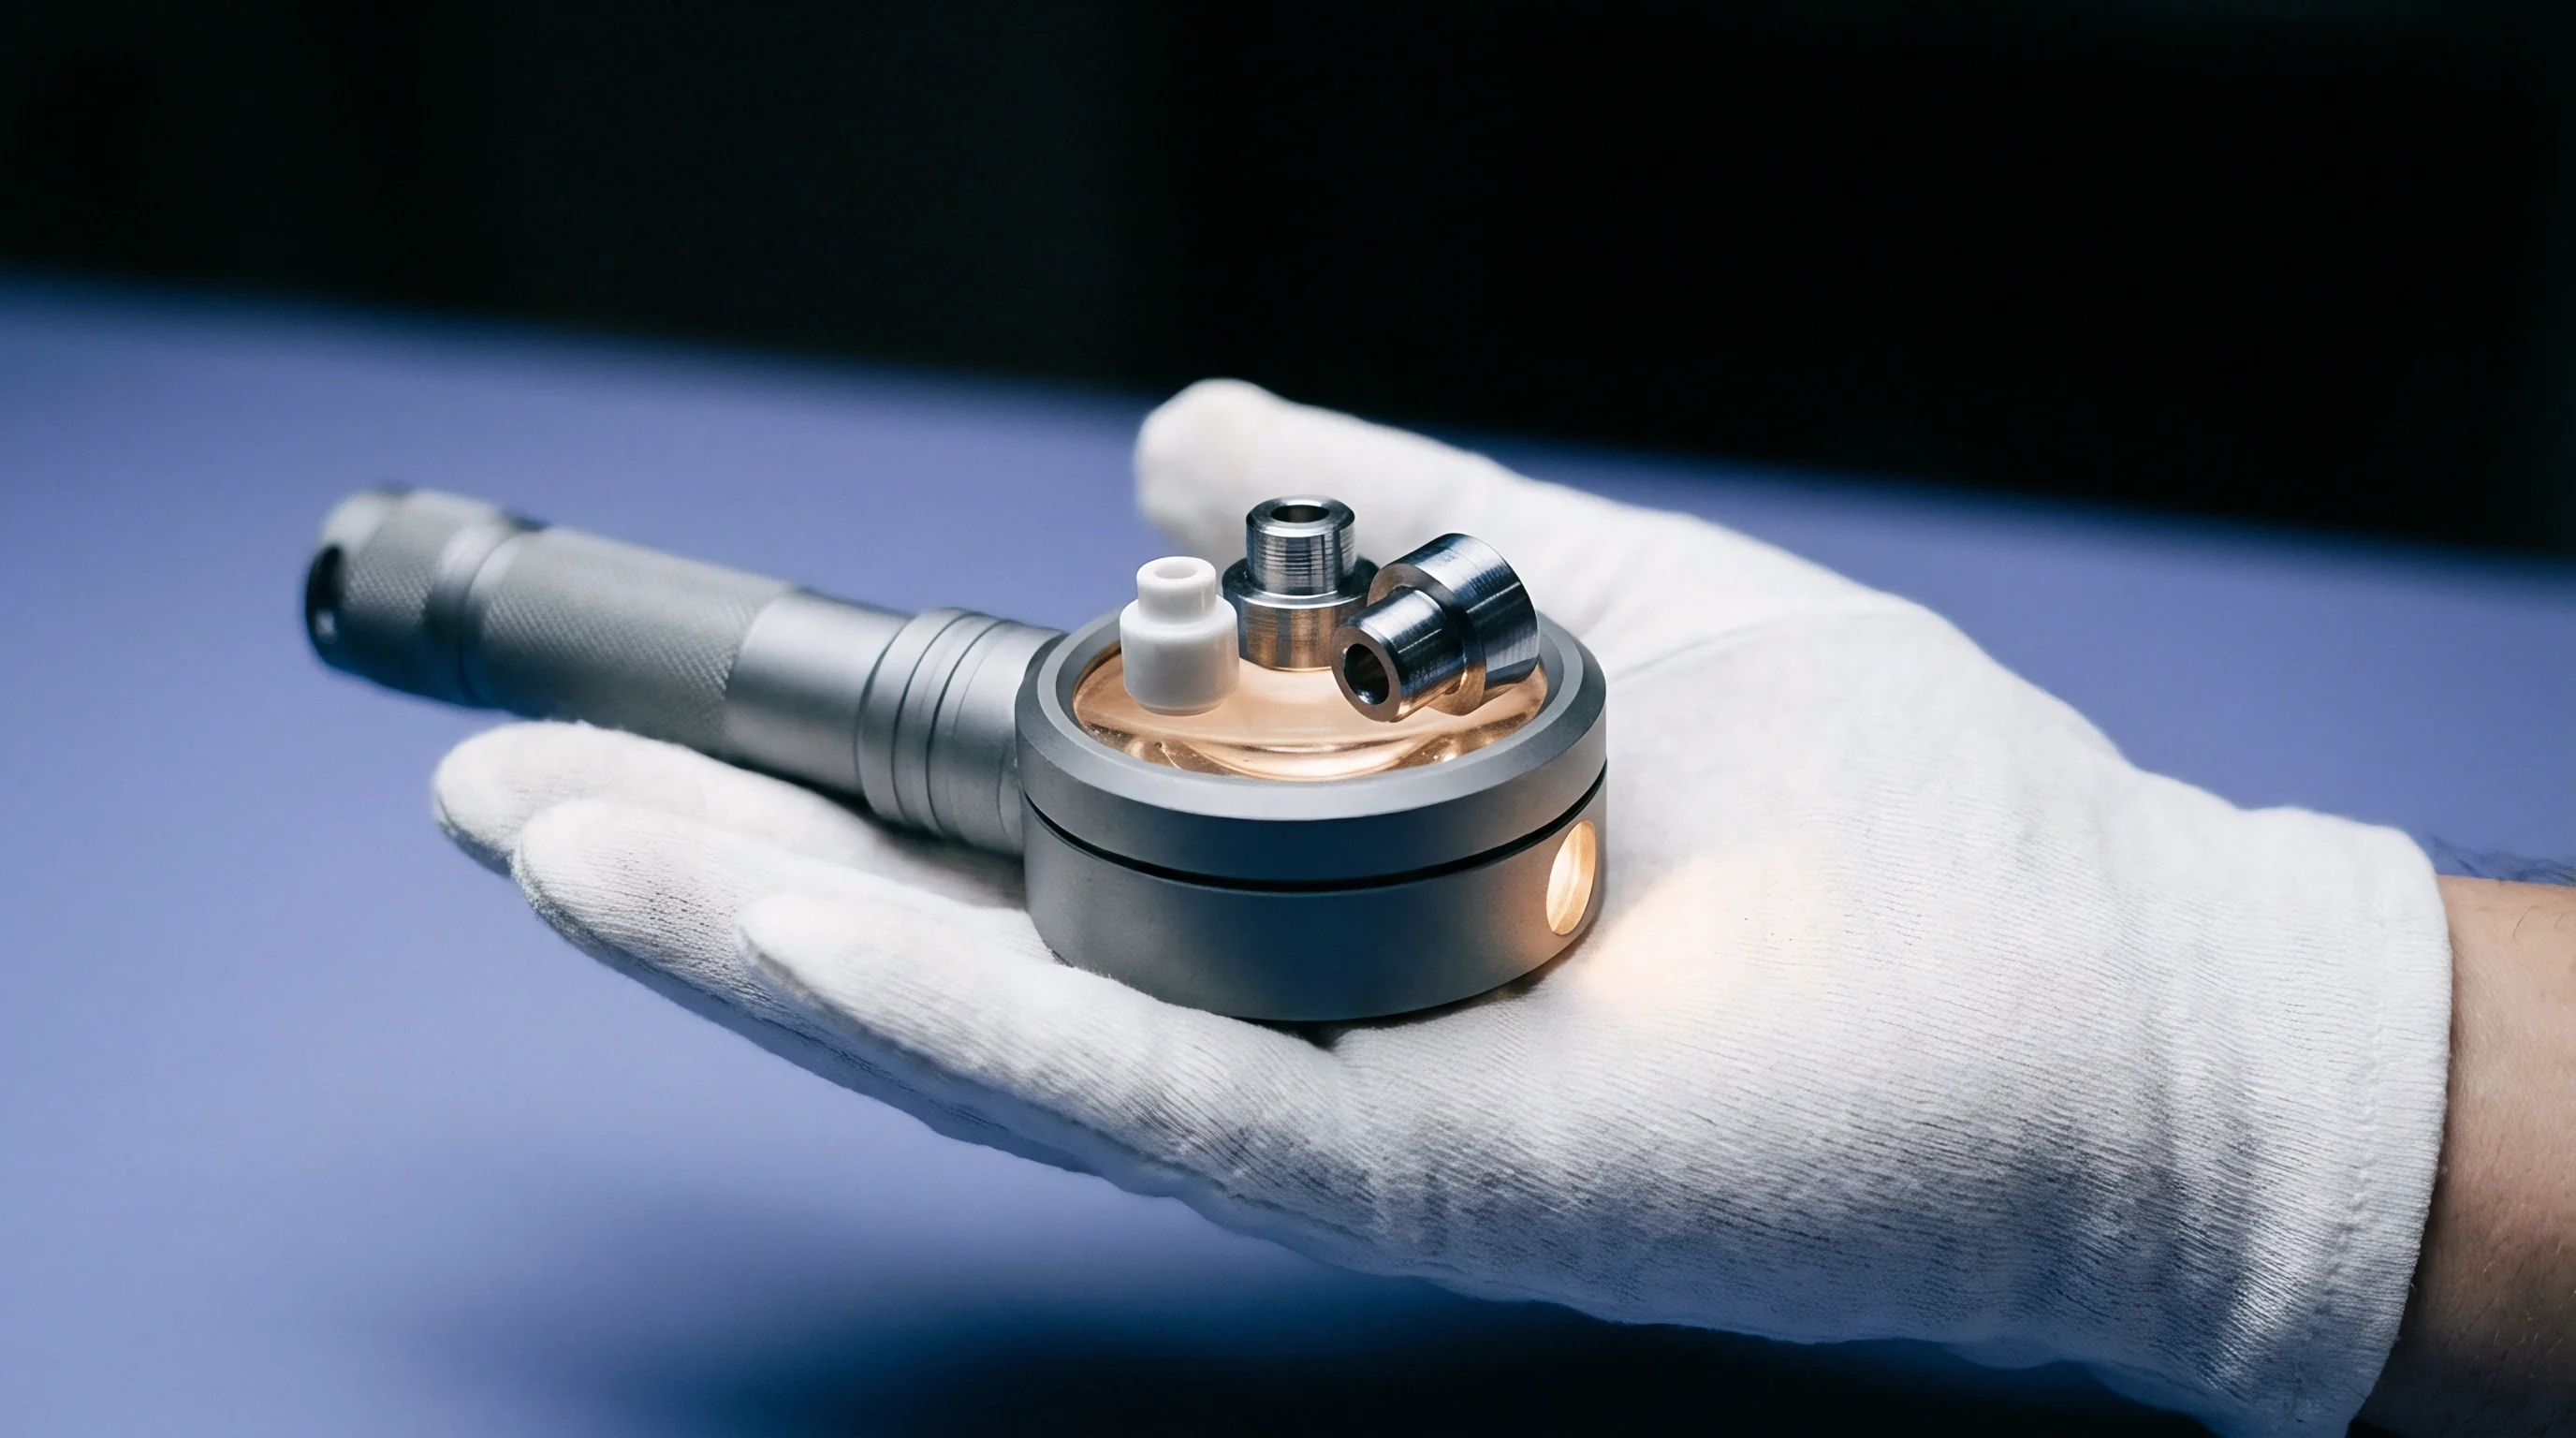
The quartz flow chamber at the tail end of Line 4 in Kunshan sits ten millimeters off the bypass valve, clouded with copper precipitate that accumulated over twenty-two continuous plating hours. Plating tanks demand steady flux. In high-density substrate fabrication, copper electroplating baths operate at elevated current densities to fill blind micro-vias and plate fine lines down to fifteen-micrometer pitch.
Continuous online spectrophotometry tracks cupric ion and sulfuric acid concentrations by piping bath fluid through an external optical bypass loop directly into an ultraviolet-visible transmission chamber. When the mechanical sample delivery system falters, spectral data drifts within minutes, corrupting the automated replenishment pump controls.
A peristaltic feed draws solution directly from the main plating reservoir at two hundred milliliters per minute. Pumping acid copper solution creates gas bubbles through cavitation, while anodic oxygen and cathodic hydrogen generation in the plating tank introduce microscopic bubbles into the fluid stream. Bubbles generate false absorption peaks.
An optical measurement chamber lacking an active debubbling mechanism misreads bubble scatter as chemical light absorption, causing the dosing system to starve the plating tank of copper sulfate pentahydrate.
A clean optical path matters more than software smoothing algorithms when monitoring copper bath chemistry.
Physical maintenance of the optical bypass demands an exacting sequence to preserve light transmission efficiency through the synthetic quartz windows. The pump stops immediately.
- Isolate the bypass assembly from the live plating reservoir using the manual polyvinylidene fluoride ball valves.
- Flush the measurement chamber with deionized water at forty degrees Celsius for three minutes to dissolve crystallized metal salts.
- Circulate ten percent volume-fraction nitric acid through the chamber for five minutes to strip copper oxide stains from optical surfaces.
- Rinse the chamber with ultrapure water until effluent electrical conductivity drops below zero point one microSiemens per centimeter.
Cupric ions in high-acid solutions absorb heavily around eight hundred nanometers. High molar absorptivity at near-infrared wavelengths saturates optical sensors when using standard one-centimeter transmission cuvettes. A standard ten-millimeter path length limits linear photometric range to bath concentrations below five grams per liter of copper, whereas production substrate baths run between twenty and sixty grams per liter.
Selecting a flow chamber with an optical path length of zero point five millimeters or one millimeter maintains total absorbance below one point five optical density units, keeping detector response within the linear dynamic range of silicon photodiode arrays. Clean flow cells prevent drift. The shift supervisor argued that slight copper plating on the glass window would automatically dissolve during the next sulfuric acid flush.


Matrix
Substrate plating baths combine copper sulfate pentahydrate and sulfuric acid with low concentrations of hydrochloric acid and organic brightening compounds. Acid concentration shifts the peak. This chemical background produces pronounced inter-element optical interactions.
High sulfuric acid shifts the copper absorption peak position and alters the molar absorptivity coefficient of the cupric-aquo complex. A univariate calibration model measuring single-wavelength absorbance at eight hundred ten nanometers misinterprets sulfuric acid variations as copper fluctuations, skewing concentration readings by up to twelve percent.

Does Background Absorption Distort Copper Peak Intensities?
High sulfuric acid concentrations modify the hydration shell around cupric ions, displacing the spectral centroid toward longer wavelengths. Dissolved bisulfate and sulfate anions compete for ligand positions, which alters the electronic transition energy of the copper d-orbital electrons. Copper sulfate absorbs strongly here.
An increase in acid concentration from one hundred grams per liter to two hundred grams per liter increases copper absorbance at eight hundred nanometers even when physical copper mass remains unchanged. Analytical software without real-time matrix correction registers this spectral change as an over-concentration of copper, suppressing automated dosing valves while the bath physically depletes.
| Chemical Component | Operating Range | Measurement Band | Interfering Species | Matrix Correction Technique |
|---|---|---|---|---|
| Copper Sulfate Pentahydrate | 20 to 65 g/L | 780 to 830 nm | Sulfuric acid, Ferrous iron | Dual-wavelength referencing at 650 nm |
| Sulfuric Acid | 100 to 220 g/L | 950 to 1050 nm | Water combination bands, Copper ions | Partial least squares chemometric regression |
| Chloride Anion | 30 to 80 mg/L | 190 to 220 nm | Nitric acid, Organic brighteners | Turbidimetric nephelometry secondary cell |
| Polyethylene Glycol Suppressor | 100 to 500 mg/L | 210 to 240 nm | Photoresist fragments, Leveler dyes | First-derivative UV deconvolution |
| Bis-3-Sulfopropyl Disulfide | 1 to 10 mg/L | 240 to 280 nm | Sulfur degradation dimers | Standard addition spiking cycle |
Polyethylene glycol suppressors and bis-3-sulfopropyl disulfide accelerators possess distinct ultraviolet absorption signatures below three hundred nanometers. Calibration curves tilt upward. As the plating bath ages through hundreds of ampere-hours, organic additives decompose under cathodic reduction and anodic oxidation into lower-molecular-weight fragments.
These breakdown products absorb across the same ultraviolet bands as fresh additives, masking the consumption of active chemistry. Spectrometers track ions without reagents. Offline cyclic voltammetric stripping provides electrochemical validation, yet online ultraviolet sensors continuously mistake inactive polyether fragments for functional suppressor molecules unless corrected against total organic carbon data.
- Hydration Sphere Displacement shifts the cupric ion absorption center toward red wavelengths when sulfuric acid concentrations fluctuate across production batches.
- Photoresist Leaching Contamination introduces aromatic ring structures into the solution that absorb heavily between two hundred twenty and two hundred sixty nanometers.
- Chloride Ion Turbidity destabilizes short-wavelength transmission readings when trace silver or lead impurities enter the plating tank through municipal feed water.
- Additive Degradation Accumulation produces sulfur-oxygen dimers that artificially inflate measured accelerator levels during multi-day production campaigns.
Unchecked optical distortion in the additive channel drives chronic overdosing, leading directly to copper nodule formation and short-circuit rejects across high-density interconnect routing.


Interference
Dissolved iron leaches continuously into the bath when plating lead frames or processing panels with exposed structural tie bars. Lead frame copper dissolution introduces ferric and ferrous ions that compromise optical precision. Iron buildup shifts the baseline.
Ferric ions form coordination complexes with sulfate that absorb radiation across the ultraviolet and visible regions up to five hundred nanometers, producing a sloping background that extends into the copper detection band. An inline spectrometer without multi-point baseline compensation attributes this iron absorption to copper, concealing real copper starvation under high plating throughput.
Under IPC-6012 Class 3 plating mandates, uncorrected spectral baseline shifts that cause plating thickness shortfalls invalidate production lot conformance certificates.

Heavy Metal Contamination Baseline Shift
Ferric ions absorb strongly across the near-ultraviolet spectrum, elevating the apparent optical density between two hundred eighty and three hundred sixty nanometers. Ten parts per million suffices. Accumulation of five hundred milligrams per liter of dissolved iron shifts baseline absorbance across the visible spectrum by zero point零四 optical density units.
This shift alters copper concentration calculations by two to four grams per liter when using single-beam optical sensors. Incorporating an isosbestic reference wavelength at five hundred eighty nanometers, where cupric absorption remains minimal and independent of temperature, allows algorithmic cancellation of heavy metal baseline drift.

Photodetector Thermal Drift and Cuvette Fouling
Ambient workshop temperatures fluctuating ten degrees Celsius alter diode response curves across a standard working shift. Spectrophotometer dark current rises with ambient thermal gain, shifting the electronic zero point. Simultaneously, hot sulfuric acid plating baths operating at twenty-six degrees Celsius cause organic additive film deposition on cool quartz surfaces.
Fouling layers attenuate beam energy uniformly across all channels, compounding apparent sample absorbance over time.
Whether standard optical correction models can accurately isolate newly synthesized third-generation levelers from accumulated photoresist breakdown fragments remains unresolved across the industry.

Correction
Multivariate mathematical calibration models resolve overlapping absorption bands by processing dozens of discrete wavelengths simultaneously. Single-wavelength Beer-Lambert equations fail in industrial plating baths because chemical components exhibit reciprocal optical interferences. Partial least squares regression and principal component regression decompose the raw spectral continuum into variance vectors, separating target analyte responses from chemical matrix variations and spectrometer baseline shifts.

Where Do Standard Additions Prevent Plating Faults?
Spiking a production sample with known volumetric increments of certified copper stock establishes an empirical baseline slope inside the live chemical environment. Matrix effects change the slope of the calibration curve without altering its linearity. By measuring absorbance before and after injecting five hundred microliters of certified standard into a designated reaction cell, the instrument recalculates the true molar absorption coefficient under current bath conditions, cancelling background interference from iron, breakdown products, and acid concentration swings.
| Algorithm Architecture | Calibration Standard Count | Copper Prediction Error | Acid Tolerance Range | Recalibration Schedule |
|---|---|---|---|---|
| Univariate Linear Interpolation | 3 standards | plus minus 3.8 g/L | 10 g/L deviation | Every 8 production hours |
| Classical Least Squares | 12 synthetic matrices | plus minus 1.4 g/L | 35 g/L deviation | Every 48 production hours |
| Partial Least Squares (PLS-2) | 24 production-bath standards | plus minus 0.4 g/L | 80 g/L deviation | Weekly production maintenance |
| Principal Component Regression | 20 production-bath standards | plus minus 0.6 g/L | 65 g/L deviation | Weekly production maintenance |
| Values reflect verification against automated potentiometric titration using 0.1M EDTA at 22 degrees Celsius across 120 production batches. | ||||

Partial Least Squares Algorithmic Execution
Decomposing the spectral data matrix into orthogonal latent variables isolates the copper signal from correlated variations in acid and breakdown products. The algorithm compresses digitized transmission data from two hundred to one thousand nanometers into five dominant latent vectors. Latent vector one tracks primary copper d-d electronic absorption, while latent vectors two and three isolate sulfuric acid bisulfate equilibria and heavy metal baseline tilt.
- Baseline Normalization deducts dark current values and subtracts transmission losses recorded at seven hundred nanometers from the complete absorption spectrum.
- First Derivative Transformation removes constant baseline offsets caused by optical chamber haze and window fouling without altering component peak ratios.
- Latent Factor Scoring projects normalized spectra against calibrated loading vectors derived from verified production bath standards.
- Concentration Reconstruction computes individual copper sulfate and sulfuric acid values through simultaneous polynomial matrix equations.
Weekly restandardization protects the line. The purchase agreement amendment specifies that calibration drift exceeding two percent of reference titration values triggers an immediate halt to panel releases pending third-party laboratory sign-off.

Scrap
Defective micro-via filling and uneven surface copper thickness generate immediate panel rejections at automated optical inspection stations. Yield drops within eight hours. Advanced flip-chip ball grid array substrates incorporate over one hundred thousand blind micro-vias per panel, where via diameters reach down to thirty micrometers.
A downward drift in copper concentration of four grams per liter decreases mass transport rates into these microscopic blind holes. Plating chemistry out of specification results in hollow via fills, void entrapment, and target pad separation under thermal stress testing.

Financial Variance in Bath Replenishment Errors
An undetected five-gram-per-liter copper deficiency alters deposit morphology, producing voids inside twenty-micrometer laser-drilled blind vias. When online spectrometers fall out of calibration, automated dosing valves either over-feed copper sulfate or fail to compensate for cathodic depletion. The buyer pays for downtime.
Substrate panels processed under miscalibrated conditions scrap out at the final automated optical inspection and electrical flying probe test stations, long after thousands of dollars in dry film, laser drilling, and plating machine time have been spent.
A two-hour delay in correcting an off-target copper concentration generates twelve thousand dollars in unrecoverable panel scrap on an eight-layer substrate line.
| Monitoring Method | Direct Labor Cost | Reagent Consumption | Scrap Losses From Bath Drift | Net Monthly Execution Expense |
|---|---|---|---|---|
| Manual Benchtop Titration (Every 4 Hours) | 3,800 USD | 1,450 USD | 22,400 USD | 27,650 USD |
| Uncorrected Online Spectrometry | 950 USD | 200 USD | 34,800 USD | 35,950 USD |
| Multivariate Matrix-Corrected Spectrometry | 1,200 USD | 450 USD | 3,100 USD | 4,750 USD |

Escalation Cadence for Chemistry Audits
Plant personnel frequently postpone manual validation titrations when digital readouts maintain flat line projections across multiple shifts. Air freight eliminates that window. A robust governance cadence pairs daily automated optical system self-checks with mandatory benchtop potentiometric cross-checks every Tuesday and Friday morning.
When the difference between the spectrometer reading and the manual titration exceeds one point five grams per liter, line technicians halt automated chemical dosing and re-zero the optical array using a certified primary standard.
Trust the physical thickness of the plated cross-section whenever the automated optical console reports nominal chemistry alongside failing micro-vias.