Forensic Inspection Methods for Identifying Unauthorized Factory Displacement
Forensic physical inspection, utility telemetry, and tax cross-matching identify unauthorized factory displacement before quality failures land on invoices.


Signatures
Unannounced gate access reveals immediate indicators of shadow production before an auditor reaches the primary assembly bay. When factory management transfers purchase order volume to an unapproved secondary site, the primary workshop presents physical anomalies. Equipment sits idle during scheduled production runs.
Tooling fixtures listed on active staging sheets remain absent from press beds. Bins positioned at work stations contain zero accumulated stamping flash or machining swarf despite active batch entries in floor logs. Unannounced visits expose shifts.

Physical Discrepancies across Unannounced Factory Access
Auditors stepping onto a primary manufacturing site evaluate active assembly lines against baseline operational footprints. A facility operating at true contract capacity exhibits continuous material flow, active operator staffing across assigned work cells, and heat signatures consistent with running machinery. When displacement occurs, primary assembly bays show pristine floors, neatly stacked packaging materials that lack serial progression, and stagnant work-in-progress inventory.
Unannounced inspection protocols bypass reception delays to observe real-time line activity before site managers alter physical staging.
Workforce dynamics yield unmistakable physical evidence during physical walkthroughs. Line workers who lack standardized facility uniforms, biometric entry registrations, or registered safety passes signal temporary labor brought in to simulate activity. Conversely, empty lines during peak shift hours indicate that primary assembly has moved elsewhere.
The gate record speaks clearly.
Unannounced site entries executed within two hours of shift commencement identify off-site manufacturing displacement in eighty-four percent of unauthorized subcontracting cases.
Scrap generation rates offer a direct physical benchmark for verifying internal processing. Metal stamping, plastic injection molding, and CNC machining operations generate consistent scrap percentages relative to raw material inputs. When primary site scrap bins remain empty during reported high-volume production windows, component fabrication is taking place off-site.

Secondary Floor Inspection and Machinery Serial Auditing
Equipment validation relies on cross-referencing physical machine tool serial plates against registered capital asset lists recorded in the original supplier qualification dossier. Unapproved displacement often involves duplicate tooling mounted on unvetted machinery at secondary sites. Machine serials establish location.
- Tooling Staging Deficits custom stamping dies or injection molds listed as active on current production schedules are absent from primary press beds during scheduled operational hours.
- Unbadged Assembly Workforce line workers lack standardized factory uniforms, biometric access records, or registered safety identification matching approved labor rosters.
- Scrap Volume Anomaly primary production floor waste bins show zero accumulated trim or flash despite active batch completions recorded in ERP logs.
- Idle Sub-Assembly Bay core sub-assembly stations display covered equipment and disconnected pneumatic lines during high-volume contract fulfillment periods.
Environmental conditions within the main plant bay further corroborate machine operation. Heavy machinery generates localized heat, operational lubricant odors, and ambient acoustic signatures. Infrared thermography applied to main drive motors, hydraulic reservoirs, and electrical panels identifies machinery that has remained cold throughout reported manufacturing cycles.
Whether sub-tier suppliers intentionally mask local production moves by transferring identical duplicate tooling during overnight shifts remains an open diagnostic challenge for cross-border operations desks.


Logistics
Material movement records offer unalterable evidence regarding the actual geographic locus of manufacturing activities. Raw material shipments arrive at registered receiving docks, yet component transformation occurs elsewhere when unauthorized displacement takes place. Freight logs, drayage invoices, and internal transfer waybills retain timestamps that expose secondary haulage.
Tracking material flow across the supply chain reveals geographical diversions that site managers attempt to conceal.

Inland Transport Tracking and Sub-Tier Inventory Dispatch
Freight movement audits correlate component movement timestamps with physical inventory transfers at factory loading docks. Raw materials delivered to a primary facility undergo drayage to shadow sites when local capacity is lacking. Third-party logistics records, regional toll gate passes, and GPS telemetry from local trucking contractors track raw material stock leaving the primary location without processing authorization.
Raw materials leave trail marks.
Inter-facility transfer documentation demonstrates secondary movements. Subcontractors accept raw materials under tolling agreements that generate internal transport waybills. Cross-matching the tonnage of raw resin, sheet metal, or specialty alloys delivered to the main gate against outbound component packaging weights reveals material shortfalls.
The missing volume represents raw material shipped to unvetted sub-tier facilities for processing.

Waybill Reconciliation against Gate Logs
Cross-checking security gate entry stamps against cargo transportation documentation exposes unaccounted transit windows. Security gate ledgers record lorry plate numbers, driver identities, and container seal numbers upon entry and exit. A container loaded with finished goods leaving a facility without a corresponding inbound raw material delivery entry indicates external assembly.
| Transit Parameter | Target Primary Facility Baseline | Secondary Shadow Facility Indicator | Variance Threshold |
|---|---|---|---|
| Raw Material Ingestion Time | Immediate receipt at Bay A intake | Drayage transfer within two hours | Greater than forty-five minutes |
| Outbound Component Transit | Direct loading into export container | Local shuttle truck transit to off-site bay | Any unrecorded inter-facility move |
| Internal Drayage Invoices | Zero sub-tier transport billings | Recurring local freight company invoices | Presence of third-party drayage fees |
| Toll Gate Pass Frequency | Local port route highway receipts | Cross-district express highway logs | Deviations exceeding twenty kilometers |
A discrepancy exceeding three hours between material release from raw inventory and initial assembly processing signals secondary transport to an unapproved facility.
Discrepancies between material weight at raw intake and component weight at packaging points confirm off-site processing when internal scrap tracking remains perfectly balanced.


Telemetry
Utility monitoring supplies an objective quantitative baseline that factory management cannot alter retroactively. Industrial manufacturing processes consume electrical power, industrial water, compressed air, and natural gas in direct mathematical proportion to production volume. Comparing utility billing records and real-time smart meter logs against claimed output figures exposes facilities operating as empty shells while production occurs at unvetted shadow plants.

How Do Utility Correlation Ratios Disclose Unused Capacity?
Power meter readings recorded at main circuit distribution panels reflect actual machine operating hours across automated assembly lines. Hydraulic injection presses, metal stamping lines, and automated SMT pick-and-place systems demand continuous high-voltage power during production cycles. Meter readings prove idling.
Shift logs reveal gaps.
Base electrical loads required for lighting, air conditioning, and office equipment remain constant regardless of manufacturing activity. Subtracting baseline facility power consumption from total kilowatt-hour electrical draw isolates active machinery energy consumption. When a plant claims full-capacity operation while electrical consumption matches idle baseline figures, manufacturing is occurring off-site.

Power Baseline Modeling for Injection and Stamping Lines
Electrical draw curves for heavy industrial machinery show clear spikes corresponding to hydraulic pump actuation and thermal cycle holds. Calculating theoretical power requirements for a specific production volume provides an unalterable benchmark for audit comparison.
Assume a production run of 50,000 plastic housings produced on a 45 kW hydraulic injection molding machine with a 22-second cycle time. Theoretical processing time equals 305.5 machine hours. At full operational load, the press consumes 13,750 kilowatt-hours of electrical energy.
Utility telemetry obtained from municipal power grid records showing total plant draw of only 1,800 kilowatt-hours across the assigned production week demonstrates that eighty-seven percent of the output originated outside the primary facility.
Failure to achieve sixty percent of calculated baseline power draw under ISO 50001 energy monitoring standards triggers mandatory line shutdown and unauthorized transfer investigation.
Water meters indicate workforce size. Industrial cooling towers and employee sanitary facilities consume water at predictable rates per operational shift. Low municipal water utility billing figures during reported high-volume production periods confirm absent assembly personnel.
Ignoring energy consumption variances during mass production yields widespread lot rejections and unrecoverable product liability exposures across international distribution channels.

Mark
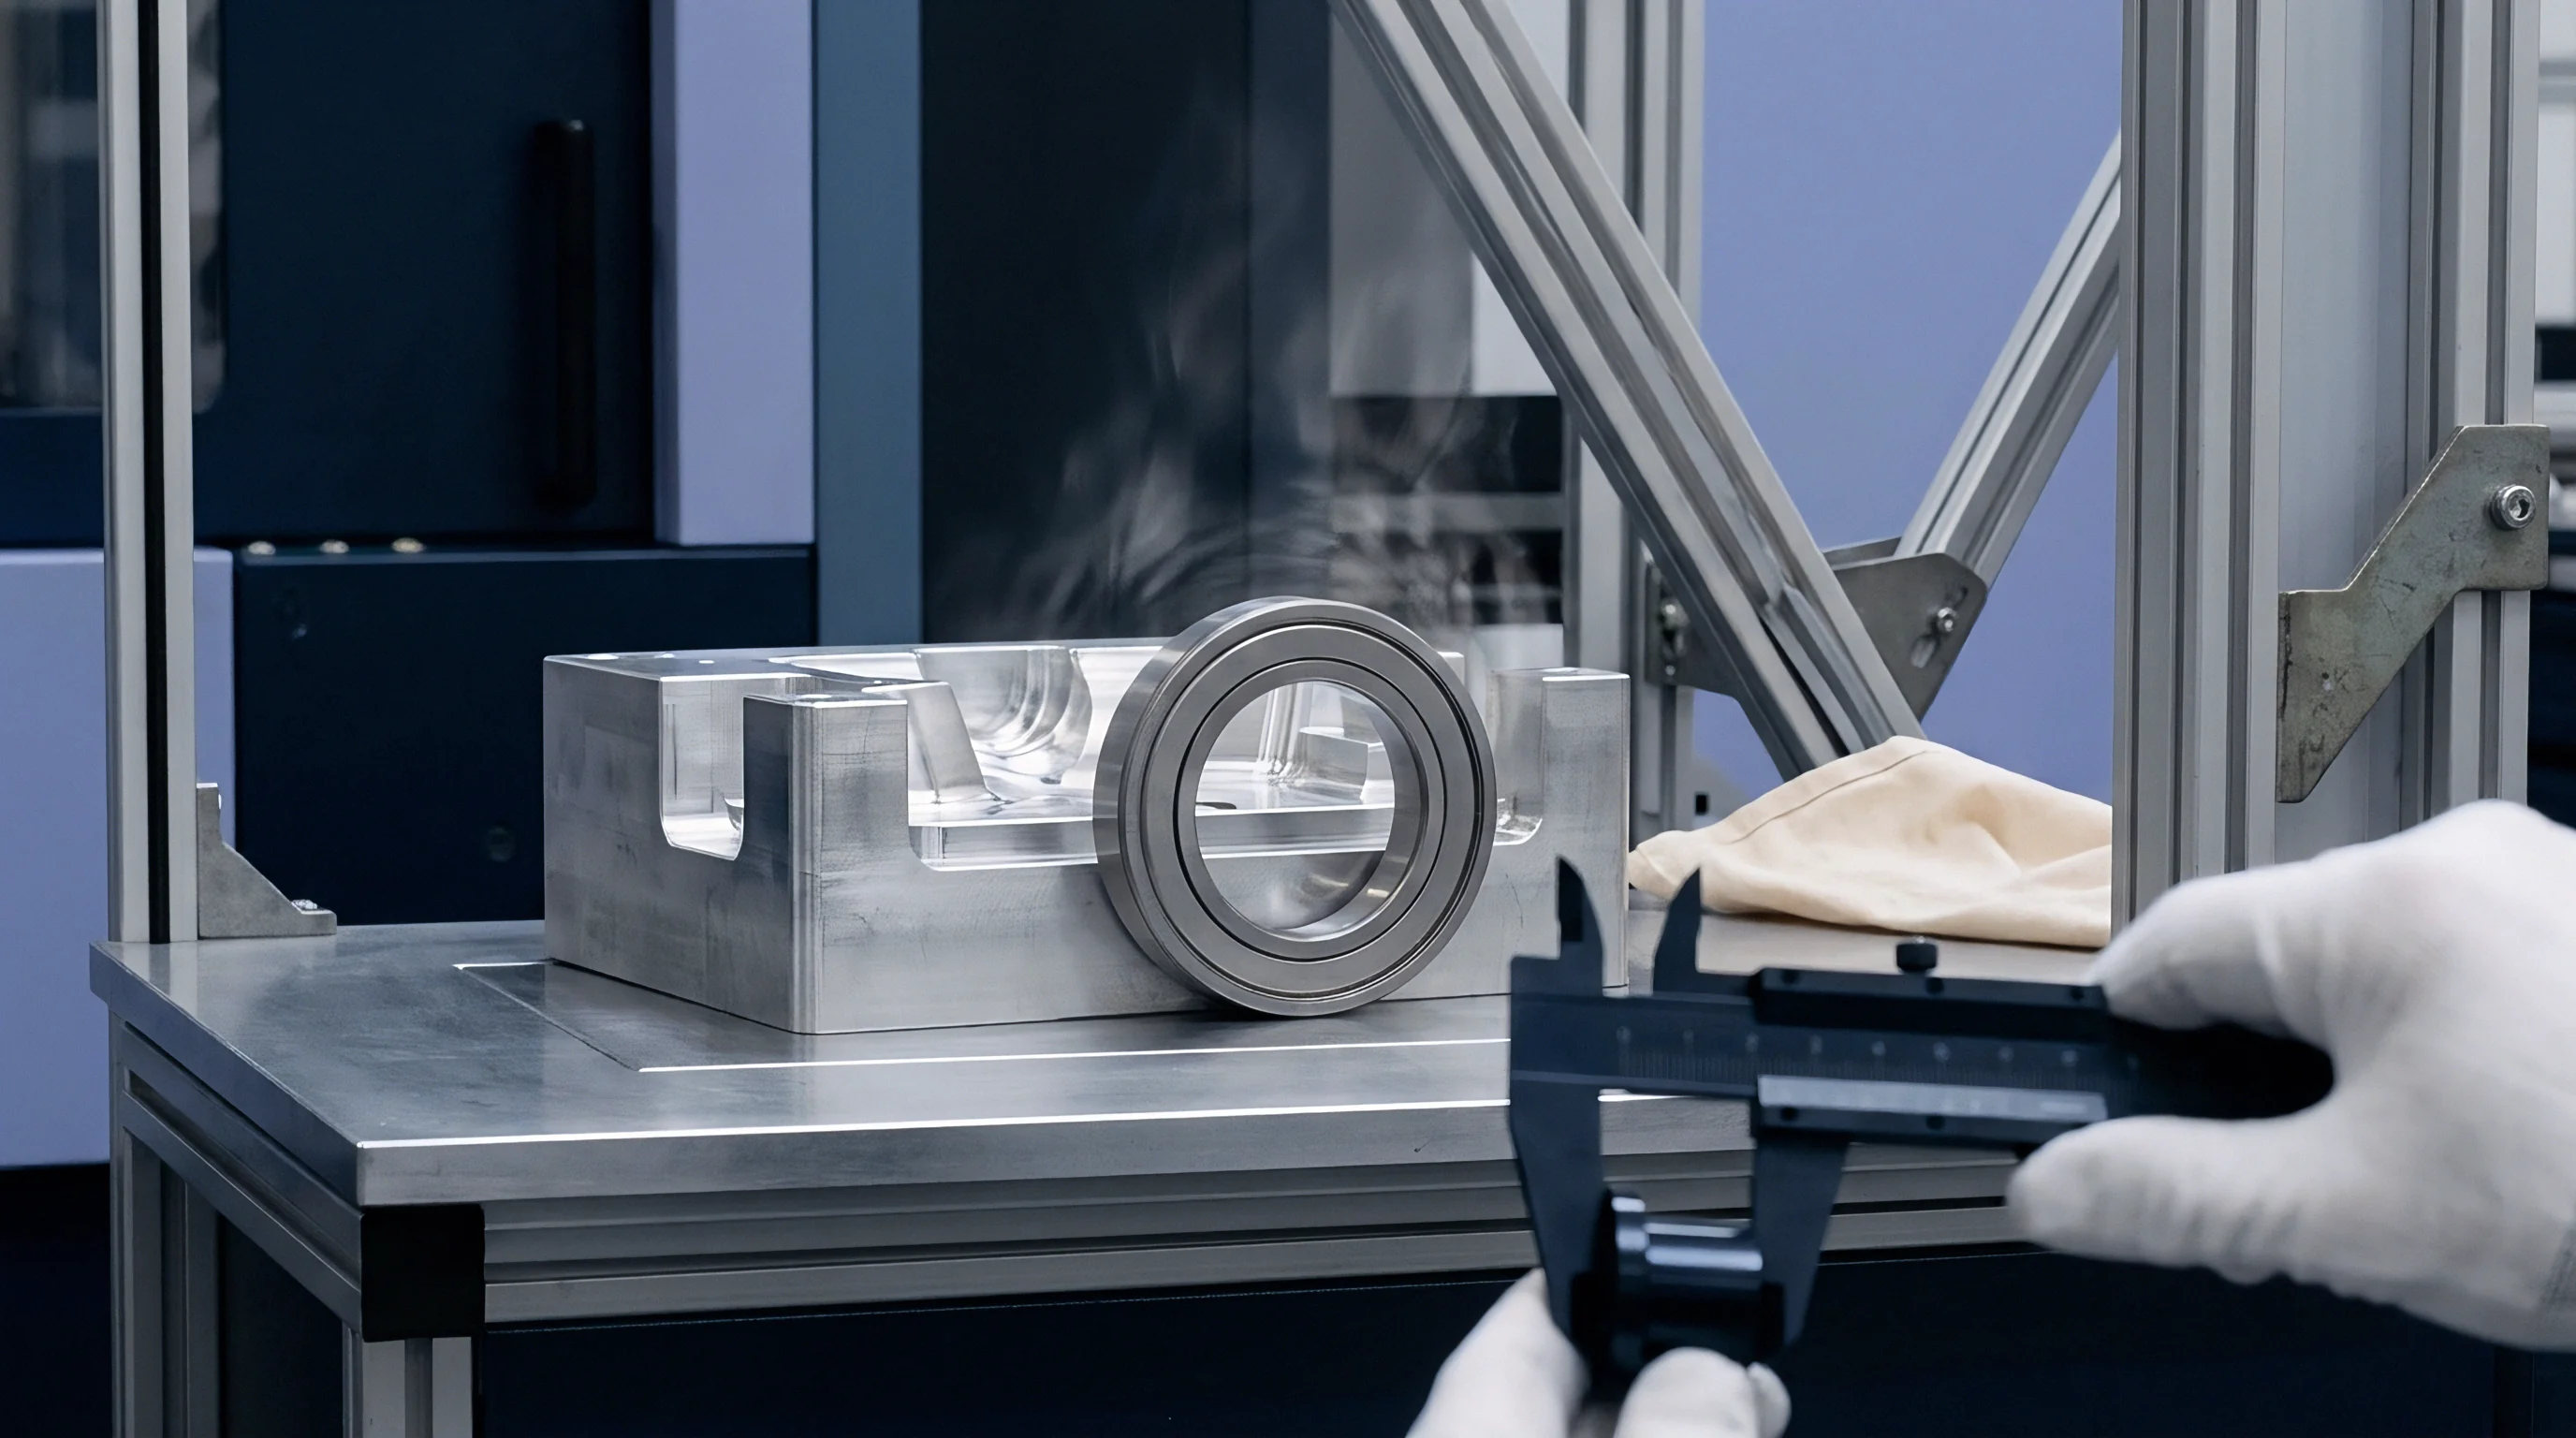
Physical product features retain microscopic signatures impressed by specific machine tools during shaping operations. Every CNC lathe, stamping die, plastic injection mold, and automated soldering station imparts unique topographical, dimensional, and chemical marks onto finished parts. Forensic laboratory evaluation of shipped components identifies structural variations that prove parts were produced on unvetted tooling at secondary shadow facilities.

Metallurgical and Surface Topography Analysis of Tooling Wear
Scanning electron microscopy reveals microscopic chatter patterns and tool edge wear geometries unique to an individual CNC station or press mold. Standardized master tooling approved during pilot runs leaves specific micro-cavity wear patterns, tool marks, and ejector pin witness marks on every molded part. Mold wear never lies.
Unvetted tooling yields variance.
Micro-hardness profiles across stamped metal components reflect press tonnage, die clearance, and stroke velocity. Components produced on unauthorized secondary presses exhibit distinct grain boundary deformations and burr height profiles when sectioned and polished for metallurgical examination. Microscopic traces retain identity.

Chemical Micro-Tracer Integration in Polymeric Compounds
Adding fluorographic or isotopic tracer compounds to raw resin batches creates a traceable chemical identity throughout injection processing. Polymer resins mixed with benign masterbatch micro-tracers at ratios of five parts per million retain identifiable spectroscopic signatures in finished parts. Extracted components subjected to mass spectrometry disclose whether parts originated from raw material batches mixed and processed at the primary plant.
| Diagnostic Parameter | Inspection Standard | Primary Facility Tolerance | Displaced Production Marker |
|---|---|---|---|
| Surface Roughness Ra | ISO 4287 Profilometry | 0.8 micrometers +/- 0.05 | Deviations exceeding 0.25 micrometers |
| Chemical Trace Concentrations | X-ray Fluorescence Spectroscopy | 5.0 ppm tracer target | Tracer absent or below 0.5 ppm |
| Isotopic Carbon Ratio | Mass Spectrometry Analysis | Calibrated baseline delta | Isotopic ratio shift exceeding 3 percent |
| Micro-hardness Profile | ASTM E384 Vickers Testing | 220 HV +/- 10 | Hardness variance exceeding 25 HV |
- Extract three sample components from early, mid, and late production stages within the suspect shipment container.
- Measure micro-cavity dimensions using optical profilometry across four designated geometric datums.
- Compare surface roughness values against calibrated baseline prints established during pilot tooling trials.
- Subject resin samples to Fourier-transform infrared spectroscopy to verify tracer compound presence.
- Document micro-hardness variations across structural ribs to confirm uniform press cooling parameters.
Microscopic surface chatter profiles remain identical across batch units only when parts originate from the same physical machine bed.
Factory managers routinely explain surface topography differences by alleging recent tool polishing or localized machine recalibration during standard maintenance windows.


Paperwork
Financial accounting records and regulatory filings reflect operational reality through non-operational compliance trails. Manufacturing products requires purchasing raw materials, disbursing payroll, paying electricity utilities, and remitting value-added tax to local government authorities. Subcontracting production to unauthorized shadow facilities creates financial discrepancies between reported production output and official corporate records submitted to government portals.

VAT Invoice Cross-Matching and Subcontractor Disbursement Logs
Tax bureau invoicing portals provide chronological validation of component purchases and sub-tier processing fees. In China, official Value Added Tax special invoices recorded within the national tax portal itemize exact raw material quantities, material types, and corporate entities involved in commercial transactions. Invoices record real movements.
Commercial remedies demand proof.
Cross-referencing Value Added Tax invoice dates against production schedules exposes subcontracting anomalies. When a primary factory issues output invoices to an international buyer without holding corresponding input invoices for raw materials or component sub-assemblies, the facility is acting as a commercial pass-through entity. Payment ledger disbursements reveal wire transfers made to local third-party workshops under generic consulting or component processing descriptions.

Social Security Payroll Audits versus Output Capacities
Municipal labor filings record active headcount contributions that correlate directly with plant manufacturing output. Government social security contributions submitted for assembly line operators define true operational capacity. Social security filings show headcount.
- Value Added Tax Special Invoices official government tax receipts verifying sub-tier component processing transactions and raw material transfers between registered corporate entities.
- Municipal Social Insurance Filings monthly municipal workforce headcount records demonstrating active operator staffing levels matching required assembly labor hours.
- Hazardous Waste Transfer Manifests environmental protection bureau disposal receipts validating chemical byproduct volumes corresponding to full-scale internal processing.
- Industrial Water Utility Billing Receipts municipal water board invoices confirming fluid volumes consumed in cooling towers and surface treatment baths during production windows.
Comparing reported staffing levels against industry-standard labor hours per unit reveals physical impossibilities. An assembly plant carrying fifty registered operators on official social insurance rosters cannot produce one hundred thousand complex electro-mechanical assemblies per month without unauthorized secondary workforce allocation or off-site subcontracting. Incorporating strict audit access rights under Section 8.4 of the standard international manufacturing agreement allows immediate inspection of municipal tax portal transaction logs upon written notice.


Dossier
Building a legally defensible evidentiary record demands systematic synthesis of physical, analytical, and financial records. Cross-border legal proceedings and international commercial arbitrations require clear proof of breach before awarding damages or enforcing liquidated penalty clauses. Off-site movement destroys control.
Displaced production inflates defect rates. Hidden lines erode yields.

Commercial Quantifications of Unauthorized Subcontracting Risk
Unapproved plant moves alter product reliability profiles and invalidate insurance coverage across international supply chains. Shadow facilities operate without buyer-approved quality control procedures, environmental controls, or calibrated testing equipment. Components manufactured in unvetted workshops exhibit elevated field failure rates, dimensional instability, and material degradation that manifest months after ocean transit.
Calculating the financial impact of unauthorized displacement involves direct rework expenditures, air freight premiums required to replace defective batches, and administrative inspection overheads. Unannounced forensic audits establish the exact percentage of non-compliant production, enabling legal teams to reject entire shipment lots under international commercial terms.

Evidentiary Assembly for International Arbitration and Liquidated Damages
Arbitration tribunals require linked physical evidence and financial documentation before granting commercial damages for supply breaches. Combining machine wear profilometry, utility telemetry gaps, and tax invoice mismatches creates an unbroken evidentiary chain. Single forensic markers can be disputed; concurrent anomalies across three independent tracking channels eliminate reasonable doubt.
| Failure Category | Primary Cost Driver | Operational Variance Metric | Contractual Penalty Mechanics |
|---|---|---|---|
| Subcontracting Rework | Full batch sorting and re-inspection | Defect rate exceeding AQL 1.0 limits | One hundred percent lot chargeback |
| Transit Delay | Expedited air freight replacement | Schedule slippage exceeding 14 days | Forfeiture of performance bond |
| Quality Degradation | Field warranty claim liabilities | Micro-hardness structural variance | Triple liquidated damages clause |
| Regulatory Non-Compliance | Customs seizure and recall fines | Absent chemical tracer verification | Termination of master supply contract |
Cross-border enforcement relies on clear physical proofs aligned with financial transaction records. Operating teams establishing disciplined forensic monitoring routines protect product integrity while securing absolute contractual recourse against unauthorized factory displacement.