Resolving Sub-Nanometer Interface State Densities under High Voltage Temperature Stress Cycles
Sub-nanometer interface trap resolution requires sub-microsecond pulse measurements to prevent recovery masking during high-voltage thermal stress cycles.

Oxide
Gate dielectric layers thinner than one nanometer experience extreme localized electric fields when biased near breakdown limits. At film thicknesses between 0.6 and 1.2 nanometers, single atomic displacement events change local potential barriers, creating electronic states within the semiconductor bandgap. In wide-bandgap transistors such as silicon carbide MOSFETs and gallium nitride high-electron-mobility structures, these localized states trap charge carriers, causing threshold voltage drift, transconductance degradation, and drain current collapse during high-voltage thermal cycling.
Stress cycling under high electric field vectors combined with elevated temperatures drives oxygen vacancy formation and broken bonds at the boundary. When a power device operates under repeated pulse stresses at junction temperatures exceeding 175 degrees Celsius, trap generation across sub-nanometer interfacial dielectrics shifts from uniform background state creation to clustered defect networks. Sub-nanometer dielectrics break under voltage stress.

Physical Trap Generation Mechanisms in Thin Interfacial Layers
High-voltage stress forces hot electrons and tunneling hole currents through the thin gate barrier. Energy transfer from energetic carriers breaks passivated bonds, creating dangling atomic bonds at the transition plane. In silicon carbide devices, carbon-cluster defects and silicon vacancies form localized energy levels within 0.2 to 0.8 electron-volts of the conduction band edge.
These near-interface traps exchange charge rapidly with the semiconductor channel, altering high-frequency dynamic responses.
Simultaneously, slower border traps located within the first 0.5 nanometers of the oxide layer capture charge through space-charge-limited tunneling mechanisms. Thermal stress accelerates structural bond breakage. During negative bias stress cycles, hydrogen species dissociate from passivated sites, diffusing away from the boundary and leaving unpassivated acceptor-like interface states.
These states accumulate negative charge under forward bias, shifting the gate operating voltage upward and reducing channel carrier mobility.
Interfacial defect generation rate tracks exponentially with applied electric field strength across thin gate dielectrics.

Thermal Energy Acceleration and Electric Field Vectors
Thermal agitation weakens strained dielectric atomic bonds, lowering the threshold energy needed for defect creation. When temperature cycles span from minus 40 degrees Celsius to plus 175 degrees Celsius under continuous 800-volt off-state biasing, thermal expansion mismatch across the oxide-semiconductor junction induces mechanical stress fields. This lattice strain lowers the formation energy of oxygen vacancies within transitional oxide layers.
The combination of high localized electric fields exceeding 3 megavolts per centimeter and active thermal excitation drives defect formation rates orders of magnitude higher than room-temperature static bias testing. Trap density shifts alter gate threshold. Evaluating sub-nanometer interface trap creation under combined thermal and electric stress demands separating transient charge trapping from permanent structural degradation.
| Dielectric Interface Architecture | Initial Interface State Density (cm⁻² eV⁻¹) | Post-Stress Interface State Density (cm⁻² eV⁻¹) | Dominant Defect Energy Level (eV) | Primary Failure Mode |
|---|---|---|---|---|
| Silicon Carbide / Silicon Dioxide (0.8 nm transition layer) | 2.5 x 10¹¹ | 1.8 x 10¹² | E_c – 0.15 to E_c – 0.35 | Threshold voltage instability via fast near-band edge trapping |
| Gallium Nitride / Aluminium Oxide (1.1 nm interfacial oxide) | 4.0 x 10¹¹ | 3.2 x 10¹² | E_c – 0.40 to E_c – 0.65 | Dynamic drain resistance increase via slow border trapping |
| Silicon / Hafnium Oxide / Oxide Stack (0.5 nm interfacial silicate) | 1.2 x 10¹⁰ | 8.5 x 10¹¹ | E_v + 0.20 to E_v + 0.45 | Transconductance drop via interface state accumulation |
Thinner interfacial layers concentrate thermal stress across fewer atomic monolayers, forcing defect generation into a sharp spatial zone right at the crystal channel interface. Higher operating junction temperatures allow trapped charges to overcome potential energy barriers, accelerating release rates and obscuring defect counts if measurements lag behind stress removal.
Spectroscopy
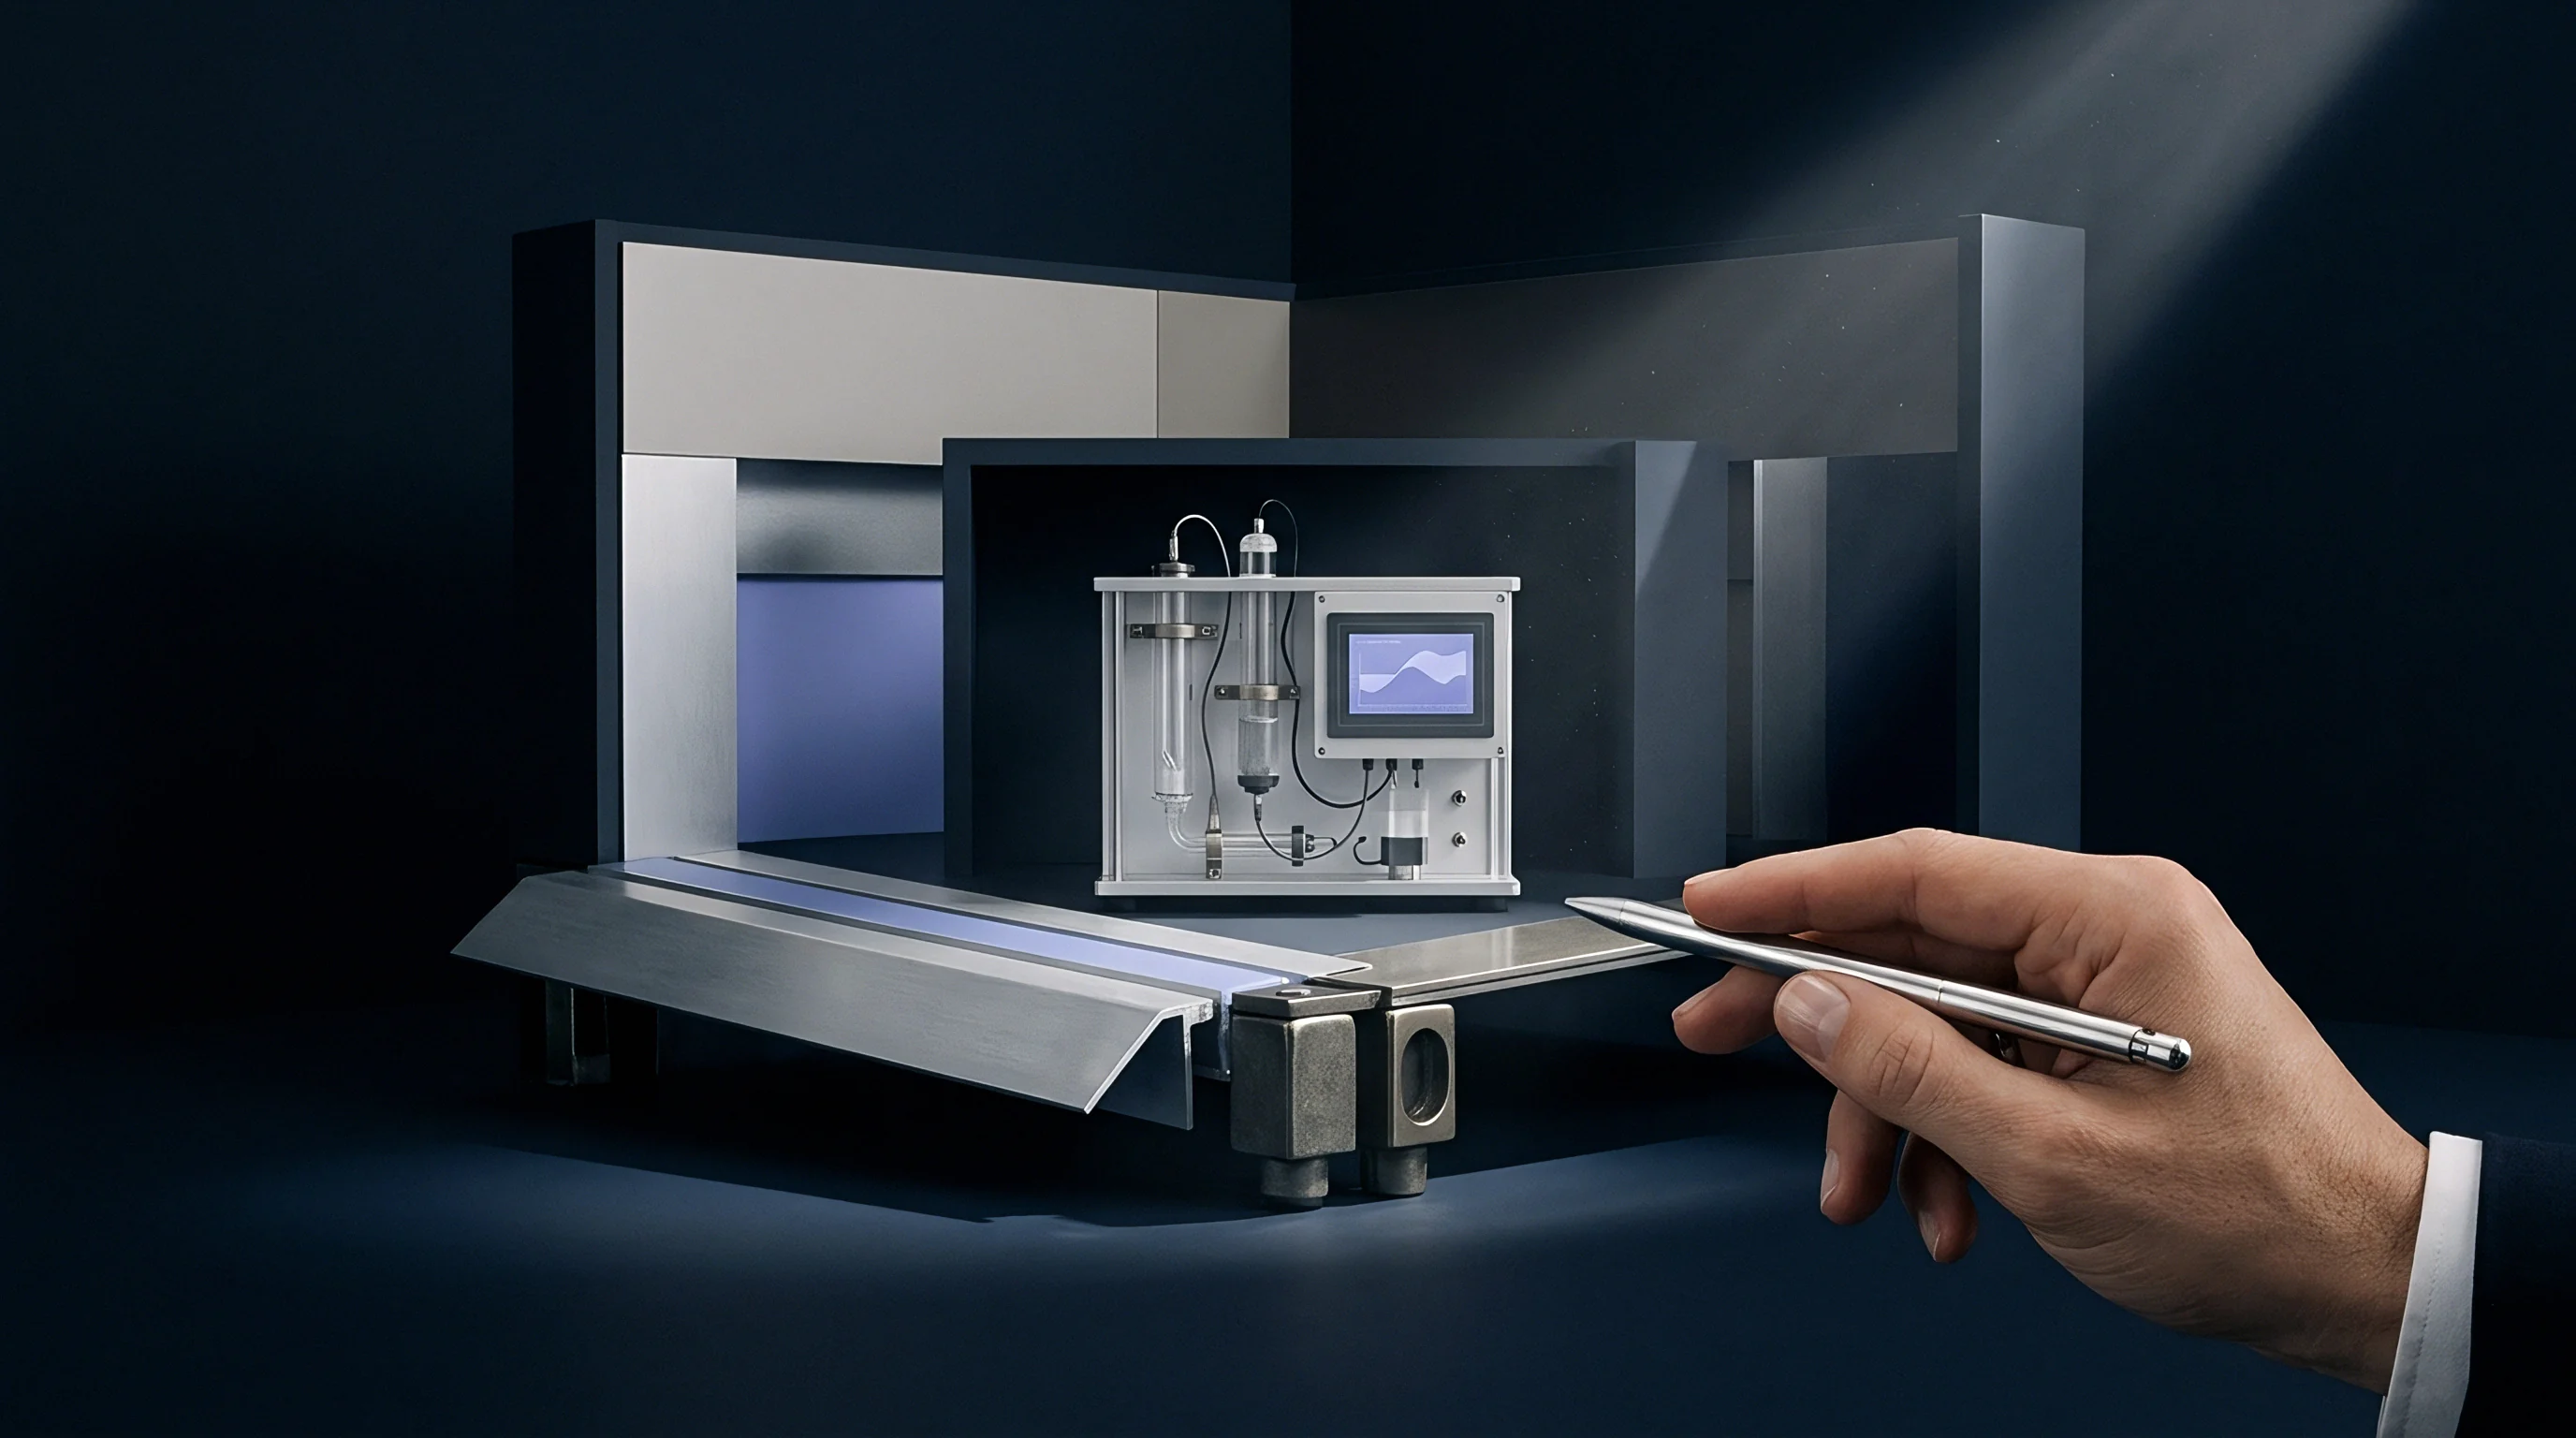
Resolving trap densities within sub-nanometer layers requires decoupling gate dielectric leakage currents from true interface capacitance responses. Standard capacitance-voltage sweeps fail when direct tunneling leakage currents through thin oxides exceed microamperes per square millimeter. Advanced high-frequency AC admittance analysis and transient charge measurement methods isolate trap response signatures by measuring the phase lag between applied voltage excitation and induced interface currents across targeted frequency bands.
Conductance versus Frequency Peak Deconvolution Methods
Admittance testing sweeps AC signal frequencies from ten hertz to one hundred megahertz across varying DC bias levels. The real portion of the interface admittance, expressed as parallel conductance divided by angular frequency, exhibits a distinct peak at the relaxation frequency of target interface traps. Leakage currents distort standard capacitance sweeps.
By fitting experimental curves across frequency spectra, trap energy levels and electron capture cross-sections emerge from background tunneling noise.
- Interfacial Silicon Dangling Bonds states positioned close to the conduction band edge exchange charge on nanosecond timelines, broadening high-frequency conductance peaks.
- Near-Interface Border Traps localized within the sub-nanometer oxide matrix display frequency-dependent energy loss peaks that shift with signal amplitude.
- Acceptor-Like Deep States positioned near midgap capture channel electrons during positive gate bias, causing asymmetric frequency dispersion across elevated temperature sweeps.
- Sub-Interface Oxygen Vacancies act as fixed charge sites when ionized, distorting the surface potential calibration needed for accurate trap energy mapping.

Charge Pumping Protocol Adjustments for High Leakage Gates
Charge pumping measures recombination current generated at the interface when the gate bias sweeps the channel between inversion and accumulation. In sub-nanometer gate oxides, gate leakage currents often eclipse the nanoampere-level recombination current. Square-wave pulse sweeps with sub-nanosecond rise and fall transition times suppress tunneling leakage by shortening the time gate potential sits at peak voltage extremes.
By varying pulse rise and fall times independently, charge pumping isolates the emission rates of fast interface states from slower border traps. Fast traps relax within nanoseconds. Foundries often claim that high leakage currents render sub-nanometer interface trap extraction impossible, attributing observed threshold voltage drift to uncalibrated test setups rather than physical defect accumulation at the dielectric junction.


Pulse
Dynamic bias temperature instability testing requires sub-microsecond pulse measurements to capture fast trap behavior before thermal recovery begins. Traditional high-voltage temperature stress cycles apply bias for hours, but removing stress to perform electrical sweeps allows trapped electrons to detrap within microseconds. Uncontrolled measurement delays hide up to ninety percent of created interface defects, delivering false positive reliability results.

Sub-Microsecond Stress Interruption Timelines
Ultra-fast pulse testing systems apply stress bias, interrupt bias within ten nanoseconds, and perform capacitance or drain current sweeps within one microsecond. Charge recovery begins in microseconds. Maintaining precise pulse timing prevents defect annealing during characterization sweeps at 175 degrees Celsius.
A two-microsecond measurement delay after high-voltage stress bias release reduces measured interface trap density by forty percent at two hundred degrees Celsius.
- Set high-voltage pulse generator rise time to less than five nanoseconds using an active 50-ohm load termination.
- Align probe card ground loop connections to suppress inductive ringing below fifty millivolts across the gate terminal.
- Calibrate high-voltage switch transition timing using an ultra-low capacitance differential probe at the wafer probe tip.
- Validate noise floor sensitivity down to 100 picoamperes across high-speed current sampling channels.

Can Conductance Techniques Resolve Near-Band Edge States?
Extracting interface trap profiles within 0.1 electron-volts of the conduction band edge demands measurement frequencies above 100 megahertz. At lower testing frequencies, fast traps remain in thermal equilibrium with the channel, preventing phase lag detection. Uncompensated series resistance skews conductance peaks.
Combining high-frequency conductance measurements with sub-microsecond pulse sweeps resolves fast interface states near band edges without interference from gate tunneling currents.
When pulse fall times match trap emission time constants, energy profiling accuracy near band edges depends entirely on eliminating cable impedance mismatches between pulse switch matrices and wafer probes. Gate leakage corrupts high-frequency measurements. Does thermal recovery within the first one hundred nanoseconds of stress release alter the observed spatial distribution of newly formed border defects?

Profile
Extracting the continuous energy distribution of sub-nanometer interface state densities across the semiconductor bandgap yields quantitative defect maps. These energy mapping profiles convert measured parallel conductance peaks and high-low capacitance variance into defect densities per electron-volt per square centimeter. Mapping these densities across energy ranges clarifies whether stress cycles generate deep recombination centers or shallow trapping states that shift threshold voltages.

Energy Distribution Curves across the Semiconductor Bandgap
Bandgap profile extraction links terminal gate voltages to actual semiconductor surface potential. High-voltage stress cycles cause non-uniform potential distribution across wafer surfaces, requiring point-by-point surface potential integration. Deep level transient sweeps combined with conductance mapping reveal state density distributions across the entire wide-bandgap energy span.
JEDEC standard JESD22-A108 dictates continuous bias conditions during high-temperature stress cycles to prevent rapid defect annealing.

Spatial Depth Profiling within Sub-Nanometer Oxide Boundaries
Distinguishing true interface states sitting at the crystal boundary from near-interface border traps located inside the 0.8-nanometer dielectric demands spatial depth profiling. Varying testing signal frequencies and temperature profiles changes carrier tunneling depth limits, exposing defect locations with 0.1-nanometer spatial resolution.
| Extraction Step | Input Measurement Data | Mathematical Transformation | Target Output Parameter |
|---|---|---|---|
| 1. Subtraction of Series Resistance | Measured Impedance (Z) and Phase Angle (theta) at 10 MHz | R_s = Real(Z) in strong accumulation | Corrected Parallel Conductance (G_p) |
| 2. Surface Potential Calculation | Quasistatic and High-Frequency Capacitance Curves | Psi_s = Integral of (1 – C_qs/C_ox) dV_g | Bandgap Energy Position (E_c – E_t) |
| 3. Conductance Peak Deconvolution | G_p / angular frequency vs Frequency plots | Extract peak height (G_p/w)_max | Interface State Density (D_it) |
| 4. Spatial Depth Extraction | Temperature-dependent emission time constants | x = (1/2K) ln(tau / tau_0) | Defect Distance from Interface (x) |
Confirming profile accuracy across batch qualification samples requires enforcing documented verification routines across wafer-level test routines. Unverified qualification reports introduce field risks.
- Uncompensated Series Resistance Checks must be completed before conductance peak integration to prevent false state density inflation.
- Thermal Drift Stabilization Periods of at least twenty minutes are applied when shifting wafer chuck temperature stages during automated sweeps.
- Sub-Microsecond Delay Verification timestamps must be recorded for every stress-measure transition cycle within raw testing logs.
Standard supply contract addenda dictate that wafer qualification dossiers must include uncorrected raw capacitance-conductance matrix data files alongside final calculated interface state density curves, forcing foundries to document exact extraction correction factors.


Audit
Verifying qualification claims from overseas semiconductor foundries requires direct inspection of wafer-level reliability test benches and extraction algorithms. Foundries routinely smooth raw testing data, apply aggressive mathematical filtering, or use long measurement delay times after stress cycles to mask interface trap generation. On-site verification confirms that stress timing, temperature control, and signal calibration match agreed qualification protocols.

Foundry Wafer Level Reliability Raw Data Auditing
Auditing wafer reliability reports involves reviewing raw binary output files from probe instruments. Automated script checks compare raw admittance data against published interface state density summary tables. Test delays mask true trap counts.
Discrepancies between raw conductance data and reported trap counts frequently stem from inappropriate series resistance subtraction or hidden data smoothing algorithms.
Foundry qualification certificates frequently omit raw high-frequency conductance curves recorded during wafer level reliability stress testing.

Escalation Pathways for Discrepant Qualification Dossiers
When audit procedures uncover hidden data smoothing or non-compliant stress interruption delays, quality managers initiate formal engineering holds on wafer fab production lots. The qualification dossier gets returned to foundry yield engineering groups for full re-testing under witness oversight. Raw C-V data exposes hidden traps.
- Raw Capacitance Conductance Matrix Files containing complete frequency and voltage sweep arrays prior to mathematical filtering.
- Thermal Chamber Temperature Log Files showing continuous thermal stability records within plus or minus 0.5 degrees Celsius during stress cycles.
- Stress Interruption Delay Timestamps proving switch times below one microsecond between stress phase and measurement phase.
- Instrument Calibration Traceability Certificates confirming high-frequency impedance analyzer calibration against international standards within twelve months.
Skipping raw data verification routines allows sub-standard gate oxide lots with high trap generation rates to enter package assembly lines, multiplying field failure costs tenfold when packaged devices break down during high-voltage thermal stress cycling in customer applications.


Margin
Interface state generation directly erodes commercial operating margins by shifting transistor parameters outside datasheet limits during high-voltage thermal cycling. Increased sub-nanometer interface trap densities drive threshold voltage drift, increasing on-state conduction losses and raising junction temperatures. Screening guardbands protect product margins.
Designing appropriate test guardbands and optimization balances wafer yield against warranty risk over ten-year product lifespans.

Guardband Sizing for Threshold Voltage Drift Limits
Guardbands define the margin between initial production test acceptance limits and end-of-life device specifications. If high-voltage thermal stress cycles generate interface trap densities exceeding 10¹² per square centimeter per electron-volt, threshold voltage shifts by several hundred millivolts over device operating lifetimes. Setting production test guardbands tighter accounts for expected trap generation, rejecting marginal wafers before packaging.

Test Time Unit Economics and Screening Tradeoffs
Extended wafer-level reliability stress testing consumes probe station capacity and inflates wafer screening costs. Wafer test time drives unit cost. Balancing testing duration against defect escape rates requires precise economic modeling of probe time costs versus post-sale warranty liabilities.
| Screening Protocol Option | Stress Test Duration per Die (ms) | Added Test Cost per Wafer (USD) | Interface Defect Escape Rate (%) | Estimated 10-Year Warranty Risk per 1k Units (USD) |
|---|---|---|---|---|
| Standard DC Spot Testing (No dynamic stress cycle) | 15 | 4.50 | 3.80 | 14200.00 |
| Pulsed High-Voltage Stress Screening (100 ms pulse) | 120 | 18.20 | 0.45 | 1850.00 |
| Full Sub-Microsecond Dynamic Stress Characterization | 850 | 62.00 | 0.02 | 80.00 |
Investing in sub-microsecond pulse characterization during wafer qualification reduces escape risks to negligible levels while establishing precise screening guardbands that preserve long-term profitability across high-power chip programs.