Boundary Layer Transport Effects on Cathode Polarization and Microstructure Evolution
Controlling boundary layer species transport reduces cathode concentration polarization, preventing localized microcracking and stabilizing yield on high-nickel coating lines.

Stagnation

Hydrodynamics of Liquid Phase Mass Transfer
Mass transport across the Nernst diffusion boundary layer governs lithium ion flux between the bulk electrolyte and the porous cathode network. During rapid charge or discharge cycles, the fluid adjacent to the active particle surface exhibits a stagnant hydrodynamic region where ion movement relies entirely on molecular diffusion rather than convective flow. The effective thickness of this stagnant fluid film dictates the concentration gradient of charge carriers.
When current density scales beyond the diffusional flux capacity of the boundary film, species depletion occurs directly at the solid-liquid interface.
Process conditions during cathode slurry tape casting establish the spatial uniformity of the final electrode pore network. Shear stress applied by the doctor blade or slot-die lip aligns polymeric binder chains and solid primary precursor particles. Inadequate shear control leaves local micro-voids that alter the effective diffusion length of lithium ions through liquid-filled channels.
Variations in solvent evaporation rates during line drying create secondary boundary layers where dissolved binder migrates toward the surface, a mechanism known as binder migration. This creates a dense, non-porous crust at the electrode air boundary that restricts species exchange during subsequent cell cycling.
Electrolyte viscosity directly modulates the hydrodynamic boundary thickness inside the tortuous pore structure. High-viscosity formulations increase viscous drag, expanding the stagnant zone around high-nickel secondary agglomerates. This expanded boundary film impedes the replenishment of depleted lithium species during sustained high-power draws.
The local ion concentration drops to near-zero levels at particle surfaces while bulk electrolyte retains nominal concentration. The resulting mass transport limitation triggers secondary degradation pathways, accelerating phase transformations at the particle exterior.
Mass transport resistance in stagnant electrolyte films scales directly with the square of the pore tortuosity factor.

Species Gradient Profiles at the Porous Interface
Concentration profiles within the fluid boundary layer evolve as a function of current density, diffusion coefficient, and ion transference number. Fickian diffusion models establish that the concentration gradient across the Nernst layer steepens linearly with applied current until reaching the limiting current density. Beyond this threshold, the concentration of active species at the electrode surface collapses, forcing the system to operate under severe mass transport control.
The boundary layer thickness is not uniform across the cathode thickness; it expands deep within the electrode backing near the current collector foil.
Pore architecture directly scales the local boundary layer thickness within commercial cathodes. High-calendered electrodes with compact porosities below twenty percent compress fluid channels, increasing ionic resistance and enlarging the effective diffusion boundary around individual active particles. Conversely, uncalendered high-porosity electrodes maintain thinner boundary layers but suffer from poor particle-to-particle electronic contact.
Balancing these transport trade-offs defines the operational window for high-energy cell designs manufactured on fast coating lines.
- Diffusion Coefficient Modulation governs the rate of ionic species movement through liquid-filled pore spaces across temperature ranges.
- Transference Number Imbalance creates steep anion concentration gradients that accelerate salt precipitation within restricted pore throats.
- Tortuosity Factor Variance extends the effective path length of diffusing ions, expanding the physical boundary film thickness inside dense active layers.
Boundary transport dynamics during liquid-solid phase interactions remain governed by the local flux equilibrium established at the wet coating line.

Overpotential

Concentration Polarization under High C-Rate Discharge
Concentration polarization represents the voltage loss driven by species concentration differences between the electrode surface and the bulk solution. When a cell operates under high discharge rates, the slow movement of lithium ions across the boundary transport layer creates a pronounced concentration drop. This concentration gradient manifests as an additional electrochemical overpotential that reduces cell terminal voltage.
The magnitude of concentration polarization grows exponentially as current density approaches the diffusional limit within the cathode pores.
Electrochemical impedance spectroscopy isolates concentration polarization from activation and ohmic losses at low perturbation frequencies. The characteristic Warburg impedance spectrum expands in response to thickened boundary transport layers, reflecting elevated mass transfer resistance. In high-nickel chemistries such as NCM811, elevated concentration overpotential forces the cathode potential below the threshold where phase instability begins.
This localized thermodynamic stress destabilizes the crystal structure long before the bulk state of charge reflects a low voltage condition.
Calculated polarization values across varying discharge current densities and cathode porosity parameters show the impact of boundary layer resistance on operational cell efficiency.
| Cathode Porosity (%) | Current Density (mA/cm2) | Boundary Layer Thickness (um) | Concentration Overpotential (mV) | Mass Transport Resistance (Ohm cm2) |
|---|---|---|---|---|
| 18 | 2.5 | 14.2 | 88 | 35.2 |
| 18 | 6.0 | 18.5 | 210 | 35.0 |
| 25 | 2.5 | 8.7 | 42 | 16.8 |
| 25 | 6.0 | 11.1 | 115 | 19.2 |
| 32 | 2.5 | 5.1 | 21 | 8.4 |
| 32 | 6.0 | 6.8 | 58 | 9.7 |
Localized Current Density Distribution
Inhomogeneous mass transport across the cathode surface forces current density to distribute unevenly across the active electrode face. Areas adjacent to wide electrolyte channels experience low boundary layer resistance, attracting disproportionately high current flux. Regions choked by dense binder networks or compact particle packing suffer from severe species depletion, reducing their local current contribution.
This current maldistribution creates severe thermal and chemical hot spots across the electrode surface.
Local current density spikes accelerate degradation kinetics in favored transport zones while leaving adjacent regions underutilized. The localized overpotential drives side reactions, including transition metal dissolution and parasitic electrolyte breakdown. Over extended cycling, these micro-scale variations compound, generating non-uniform state-of-charge maps across single electrode sheets.
Factory quality audits that evaluate coating weight without measuring spatial porosity distribution miss this primary driver of early capacity fade.
Controlling mass transport boundaries within three micrometers stabilizes interfacial overpotential across all normal operating windows.


Fissure

What Triggers Structural Decay in High Nickel Cathodes?
Lattice strain originating from severe concentration gradients drives intergranular microcracking within poly-crystalline cathode particles. During high-rate extraction of lithium, the exterior shell of a secondary particle experiences rapid desolvation and contraction while the core retains a high lithium concentration. This anisotropic lattice mismatch generates tensorial stress along grain boundaries that exceeds the critical fracture toughness of the material.
The resulting intergranular fissures sever electronic pathways and expose fresh active surfaces to fresh electrolyte exposure.
Freshly exposed crack surfaces instantly form a secondary solid electrolyte interphase, consuming active lithium ions from the liquid inventory. Electrolyte penetrates the internal network of the secondary agglomerate through these newly formed fissures, carrying boundary layer transport phenomena deep into the particle core. The localized mass transport resistance inside a microcrack is significantly higher than in the primary pore structure, trapping species and amplifying concentration overpotential within the particle interior.
A twelve percent increase in localized lattice strain accelerates intergranular cracking rates by more than double across three hundred cycles.

Lattice Strain Accumulation and Vacancy Condensation
Lattice parameters contract non-linearly during de-lithiation, with the c-axis undergoing sharp collapse at high states of charge. Transport boundary layers that limit ion flux cause the particle surface to reach this critical structural collapse phase prematurely relative to the particle bulk. Vacancies generated by high-rate lithium extraction condense into micro-voids at primary grain boundaries.
These micro-voids act as stress risers, initiating fracture cascades under modest mechanical loads during electrode cycling.
Sustained mechanical degradation compromises the structural integrity of the entire cathode coating layer, leading to delamination from the current collector foil.
- Intergranular Cleavage propagates along primary particle boundaries due to severe lattice mismatch during rapid lithium extraction.
- Intragranular Transverse Fracturing splits individual primary grains when localized concentration overpotential induces extreme lattice strain.
- Exfoliation of Surface Shells detaches outer primary particles from agglomerates, eliminating conductive pathways to the core.
- Void Condensation Cascades merge atomic vacancies into macroscopic internal pores that collapse primary particle contact networks.
Ignoring particle-level transport boundaries accelerates structural breakdown, reducing calendar life and compromising thermal stability under abusive load regimes.

Kiln
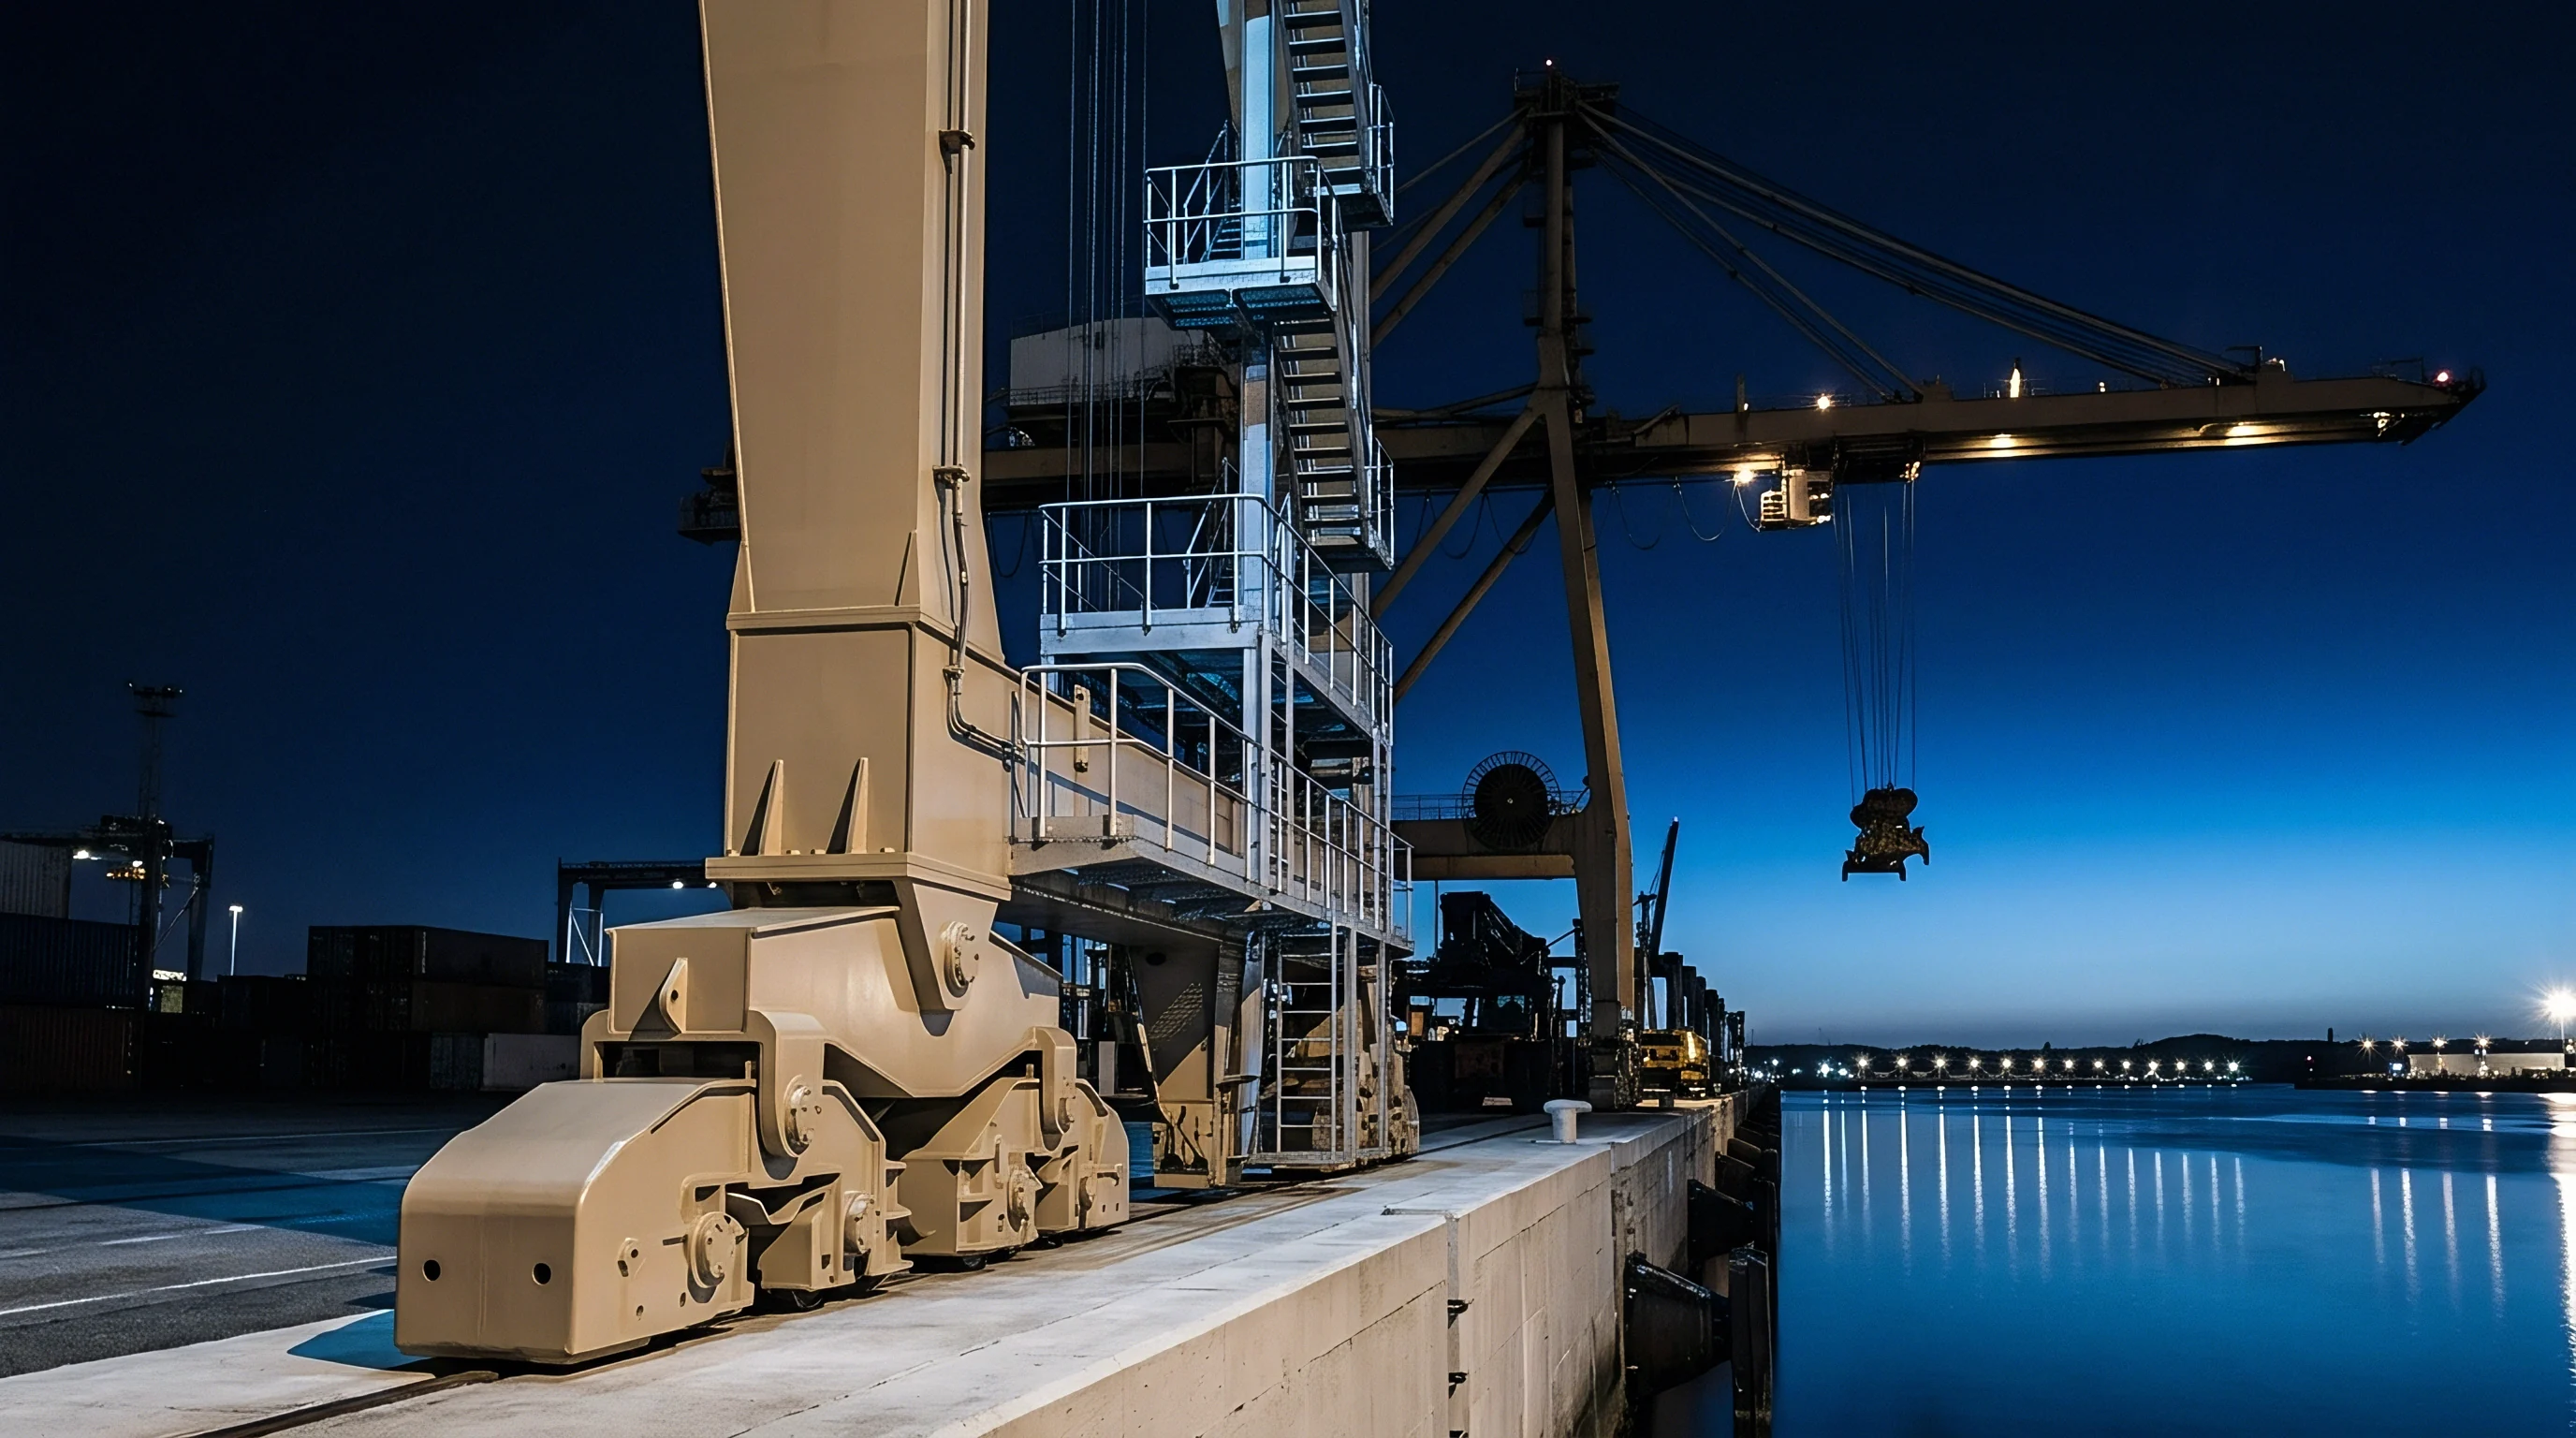
Gas Phase Mass Boundary Transport in Calcination Kilns
Solid-state synthesis of cathode precursor materials in industrial roller hearth kilns depends on precise gas-phase mass transport across the calcination boundary layer. Oxygen gas must diffuse through the stagnant gas boundary film surrounding the raw material sagger bed to oxidize cobalt and nickel species fully. Simultaneously, gaseous reaction products including moisture and carbon dioxide must diffuse outward across the same boundary layer.
Inadequate gas boundary layer transport traps moisture and carbon dioxide within the sagger core, hindering the conversion of hydroxides to stoichiometric layered oxides.
Factory kilns operating in Changzhou and Huzhou adjust purge gas flow rates to control boundary film thickness above moving sagger lines. Increasing convective gas velocity decreases the boundary layer thickness, enhancing gas exchange and accelerating phase conversion rates. When airflow velocity drops below critical thresholds, local carbon dioxide partial pressure spikes within the precursor bed, forming residual lithium carbonate impurities on primary particle surfaces.
These surface carbonates later react with liquid electrolyte during cell operation, generating gassing failures.
Continuous monitoring of oxygen partial pressure at the sagger surface reveals boundary layer transport dynamics during critical firing phases.
| Kiln Zone Designation | Temperature Range (C) | Gas Velocity (m/s) | Boundary Layer Thickness (mm) | Carbon Dioxide Removal Efficiency (%) |
|---|---|---|---|---|
| Pre-Heating Zone 1 | 200 to 450 | 0.8 | 4.2 | 78.5 |
| Calcination Zone 2 | 450 to 750 | 1.5 | 2.1 | 94.2 |
| Soaking Zone 3 | 750 to 880 | 2.1 | 1.2 | 99.1 |
| Cooling Zone 4 | 880 to 300 | 1.1 | 3.0 | 91.0 |

Thermal Gradient Dynamics in Rotary and Hearth Systems
Heat transfer across boundary transport layers limits calcination uniformity in high-capacity rotary kilns. Thermal energy transfers from the wall through a stagnant gas boundary layer into the tumbling powder bed. Poor boundary layer thermal transport creates spatial temperature variations exceeding fifteen degrees Celsius across the precursor stream.
This thermal gradient causes non-uniform primary grain growth, yielding a mixed microstructure containing both under-calcined cores and over-calcined exteriors within the same synthesis batch.
Suppliers often cite minor atmospheric fluctuations when explaining batch-to-batch variations in cathode crystal structure.
Gas boundary layer purge efficiency directly sets the residual carbonate concentration on calcined precursor primary grains.


Discrepancy

Slurry Rheology Audits and Interfacial Shear Mapping
Auditing cathode slurry quality requires mapping rheological performance across shear rates typical of industrial slot-die coating lines. Standard off-line viscosity measurements performed at single shear rates fail to detect localized mass transport anomalies that appear under high-shear coating conditions. Viscoelastic breakdown during pump transport and slot-die exit disrupts the uniform distribution of conductive carbon and binder, altering micro-porosity gradients in the wet film.
A thorough rheological dossier includes rotational flow curves, oscillatory strain sweeps, and transient step-shear recovery metrics.
Quality engineers inspect slurry mixing operations directly at the supplier facility, verifying that dispersion protocols prevent agglomerate formation. Particle size distribution metrics alone do not guarantee consistent transport boundary layer formation. High-shear rheometry exposes whether polymer chains form an interconnected network capable of resisting binder migration during the initial convective drying stage.
Slurry batches displaying incomplete elastic recovery generate uneven pore structures that exacerbate concentration polarization during fast charging.
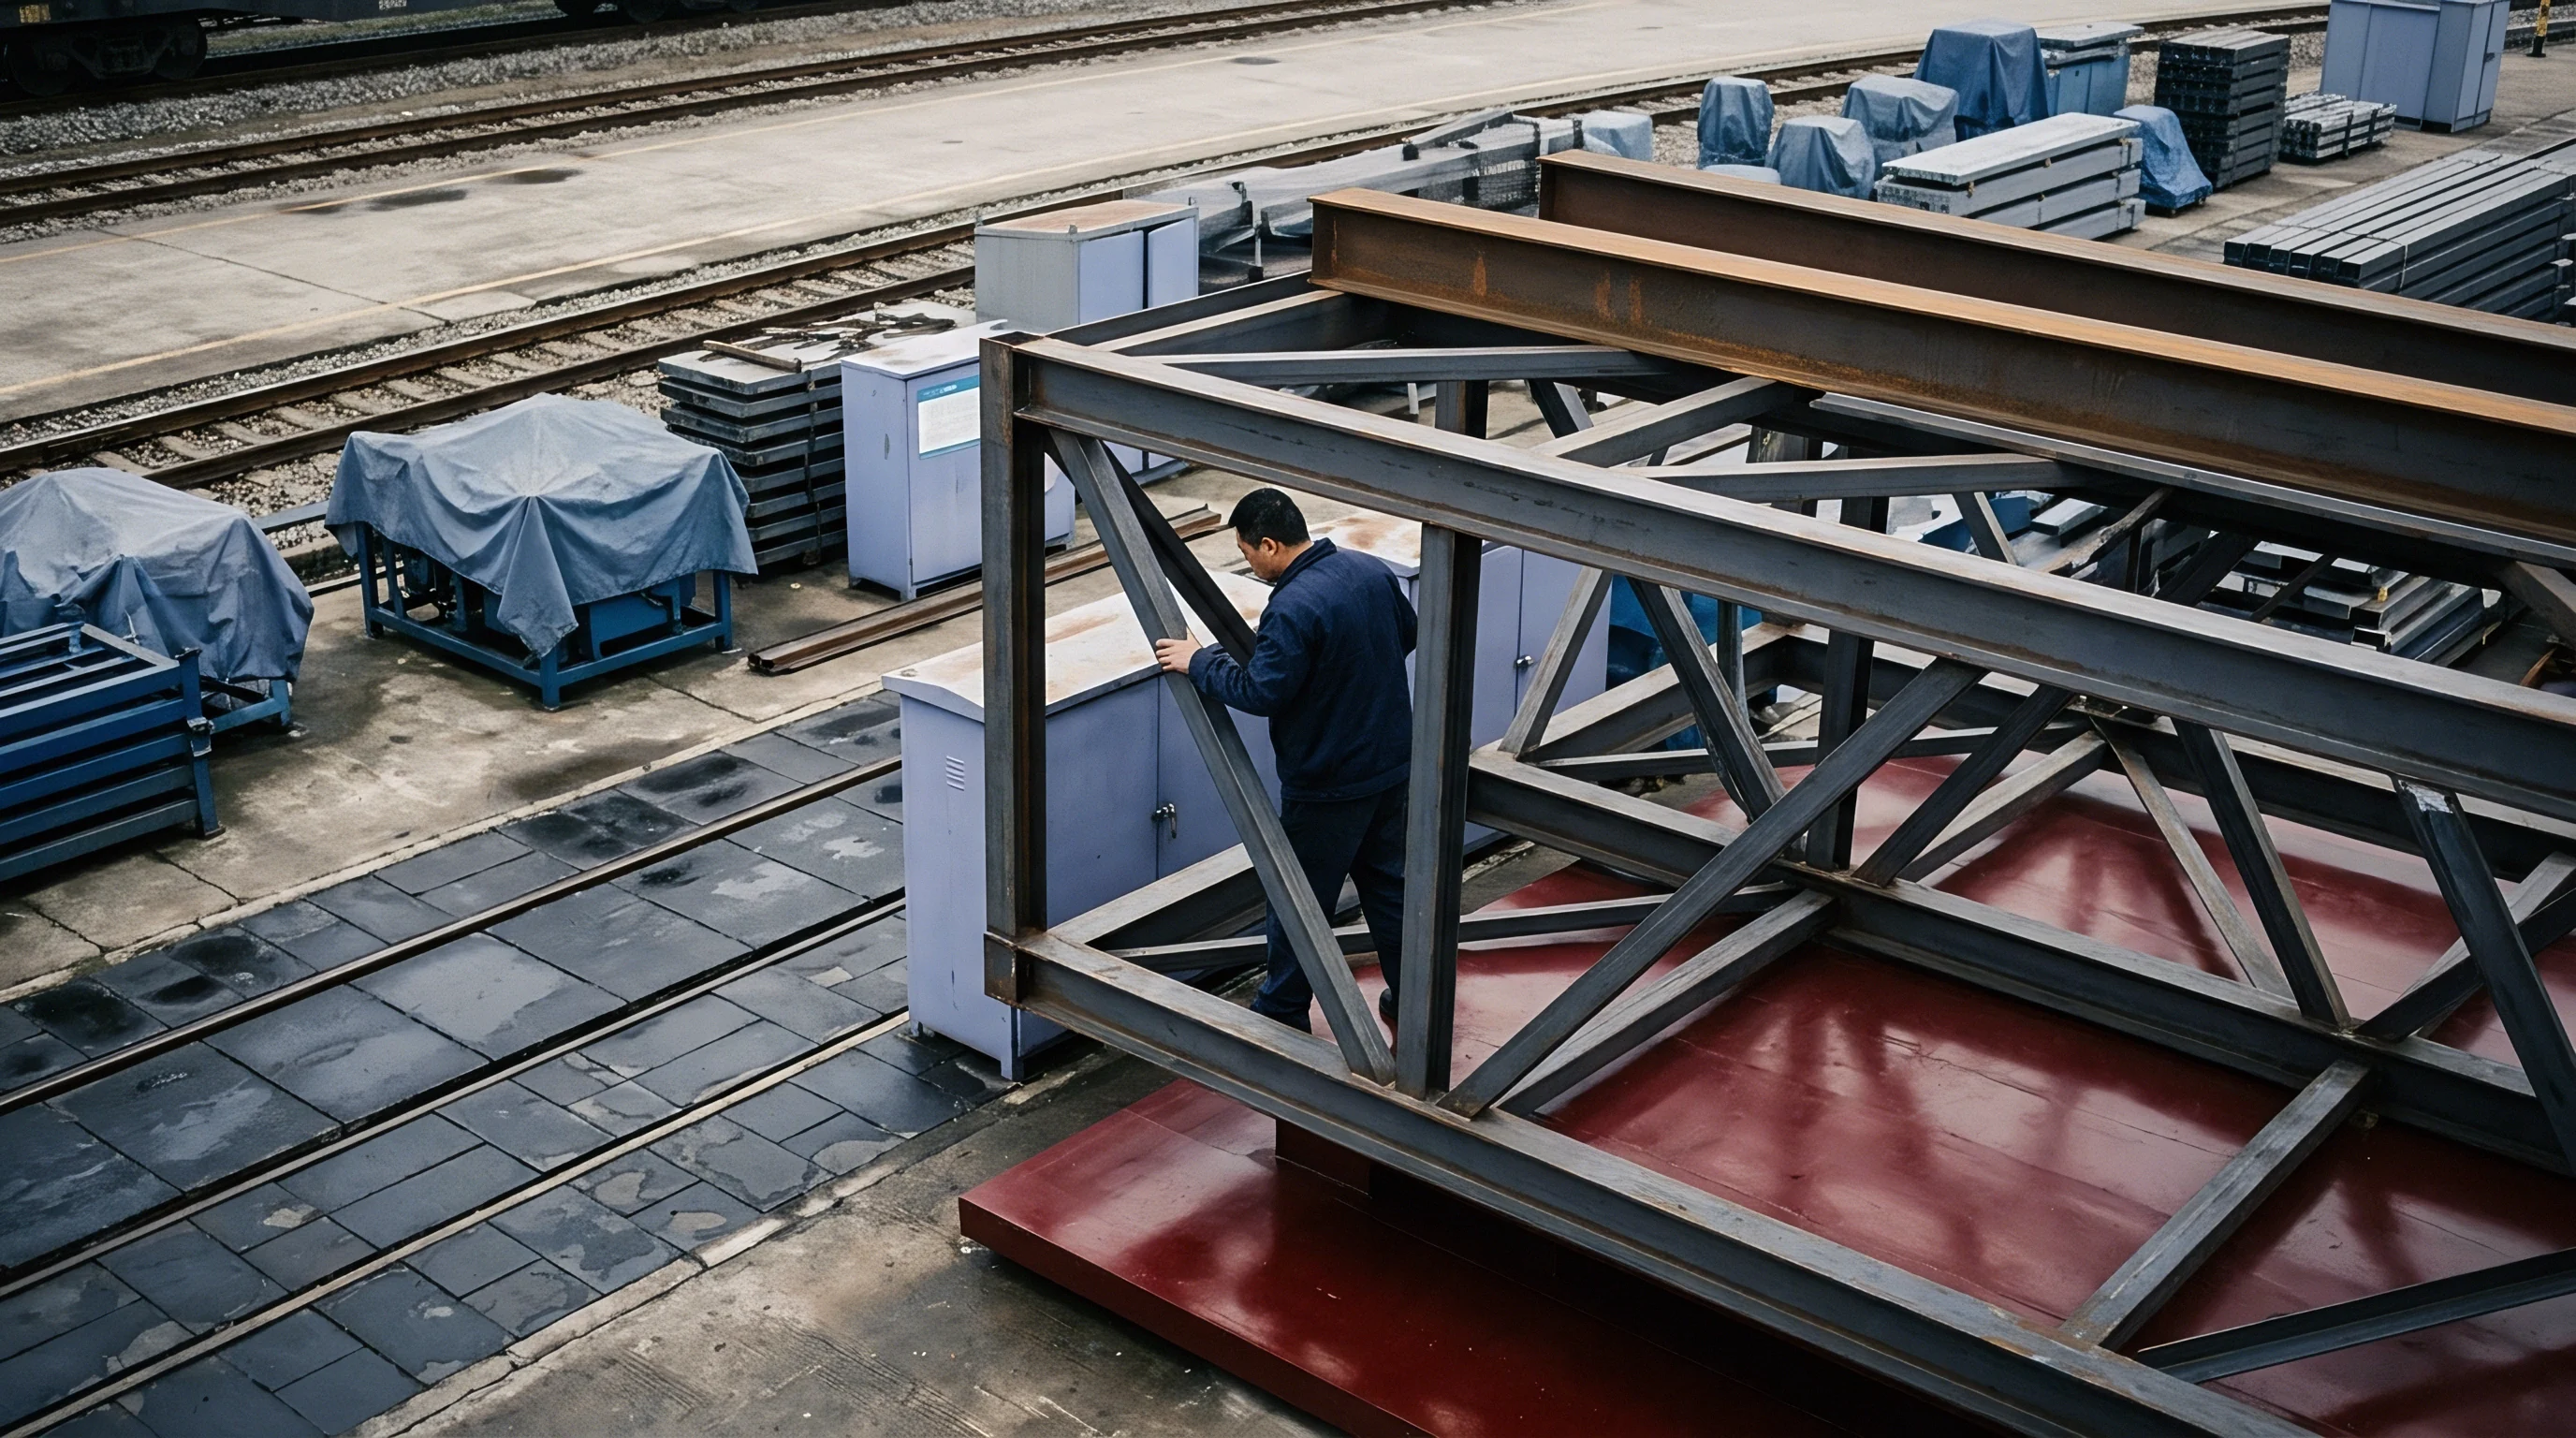
Auditing Batch Uniformity in High Volume Lines
Verifying structural consistency across large manufacturing lots demands a multi-stage audit strategy executed directly on the factory floor.
- Slurry Viscosity Verification inspects rheological stability across shear rates from 0.1 to 10,000 inverse seconds before delivery to coating heads.
- Wet Film Thickness Profiling measures transverse coating uniformity using optical displacement sensors to detect boundary layer thickness anomalies.
- Drying Zone Temperature Auditing checks heat transfer parameters across six distinct drying bays to prevent localized binder migration.
- Calender Roll Pressure Mapping verifies spatial pressure distributions to ensure uniform pore tortuosity across the entire web width.
Under Chinese Civil Code provisions governing supply contracts, buyers who accept goods without submitting written non-conformity notices regarding latent structural micro-defects within thirty days forfeit their rights to seek damages for subsequent field degradation failures.
Yield

Scrap Rate Arithmetic in Boundary Defect Production
Mass transport boundary anomalies occurring during slurry coating and calcination manifest directly as yield losses during cell formation and testing. Pinholes, binder crusts, and thickness variations alter localized current density, causing non-uniform solid electrolyte interphase formation during initial charging. Cells exhibiting anomalous formation voltage profiles are scrapped prior to aging.
A plant yielding ninety-two percent line efficiency loses eight percentage points primarily to interfacial coating defects driven by boundary transport instabilities.
Defect regimes linked to boundary transport conditions impact manufacturing cost across three distinct processing stages.
| Defect Mechanism | Originating Process Phase | Line Yield Impact (%) | Rework Scrap Cost (USD/kWh) | Landed Pack Impact (USD/kWh) |
|---|---|---|---|---|
| Surface Binder Crust | Slot-Die Drying Zone | 2.4 | 3.10 | 4.25 |
| Porosity Gradient Flaw | Calendering Line | 1.8 | 2.35 | 3.15 |
| Residual Carbonate Coating | Calcination Hearth | 3.1 | 4.15 | 5.80 |
| Microcrack Nucleation | Formation Fast-Charge | 1.2 | 1.60 | 2.20 |
Landed Pack Cost Penalties for Transport Induced Decay
Scrap generated late in the assembly process carries the cumulative cost of active materials, current collectors, electrolyte, and cell housing hardware. Scrapping a cell after formation wastes processing energy and labor alongside raw material value. A two percent increase in formation failure rate adds four dollars and fifty cents per kilowatt-hour to the total landed pack cost when accounting for wasted upstream processing hours and scrap handling overhead.
Purchasing contracts must specify boundary-layer control parameters to protect commercial terms and assign liability for microstructural flaws.
Supply agreements must define maximum allowable localized tortuosity variance across coating rolls to prevent mass transport yield losses.
To secure material quality, procurement dossiers must incorporate explicit quality criteria for active materials and intermediate slurries.
- Slurry Shear Recovery Metrics set limits on structural rebuild times after slot-die extrusion to ensure uniform pore boundary formation.
- Surface Residual Carbonate Limits define maximum allowable hydroxide and carbonate levels on calcined precursor particles.
- Cross-Web Porosity Tolerances constrain calender density variations within plus or minus one percent across the active web width.
Whether inline electrochemical mass transport screening can fully replace destructive teardown audits on high-speed continuous coating lines remains an open question for engineering teams managing supplier quality.