High Shear Rheology and Differential Scanning Calorimetry Lot Receiving Verification
Receiving verification requires capillary rheometry and differential scanning calorimetry to catch shear degradation and glass transition shifts before production.
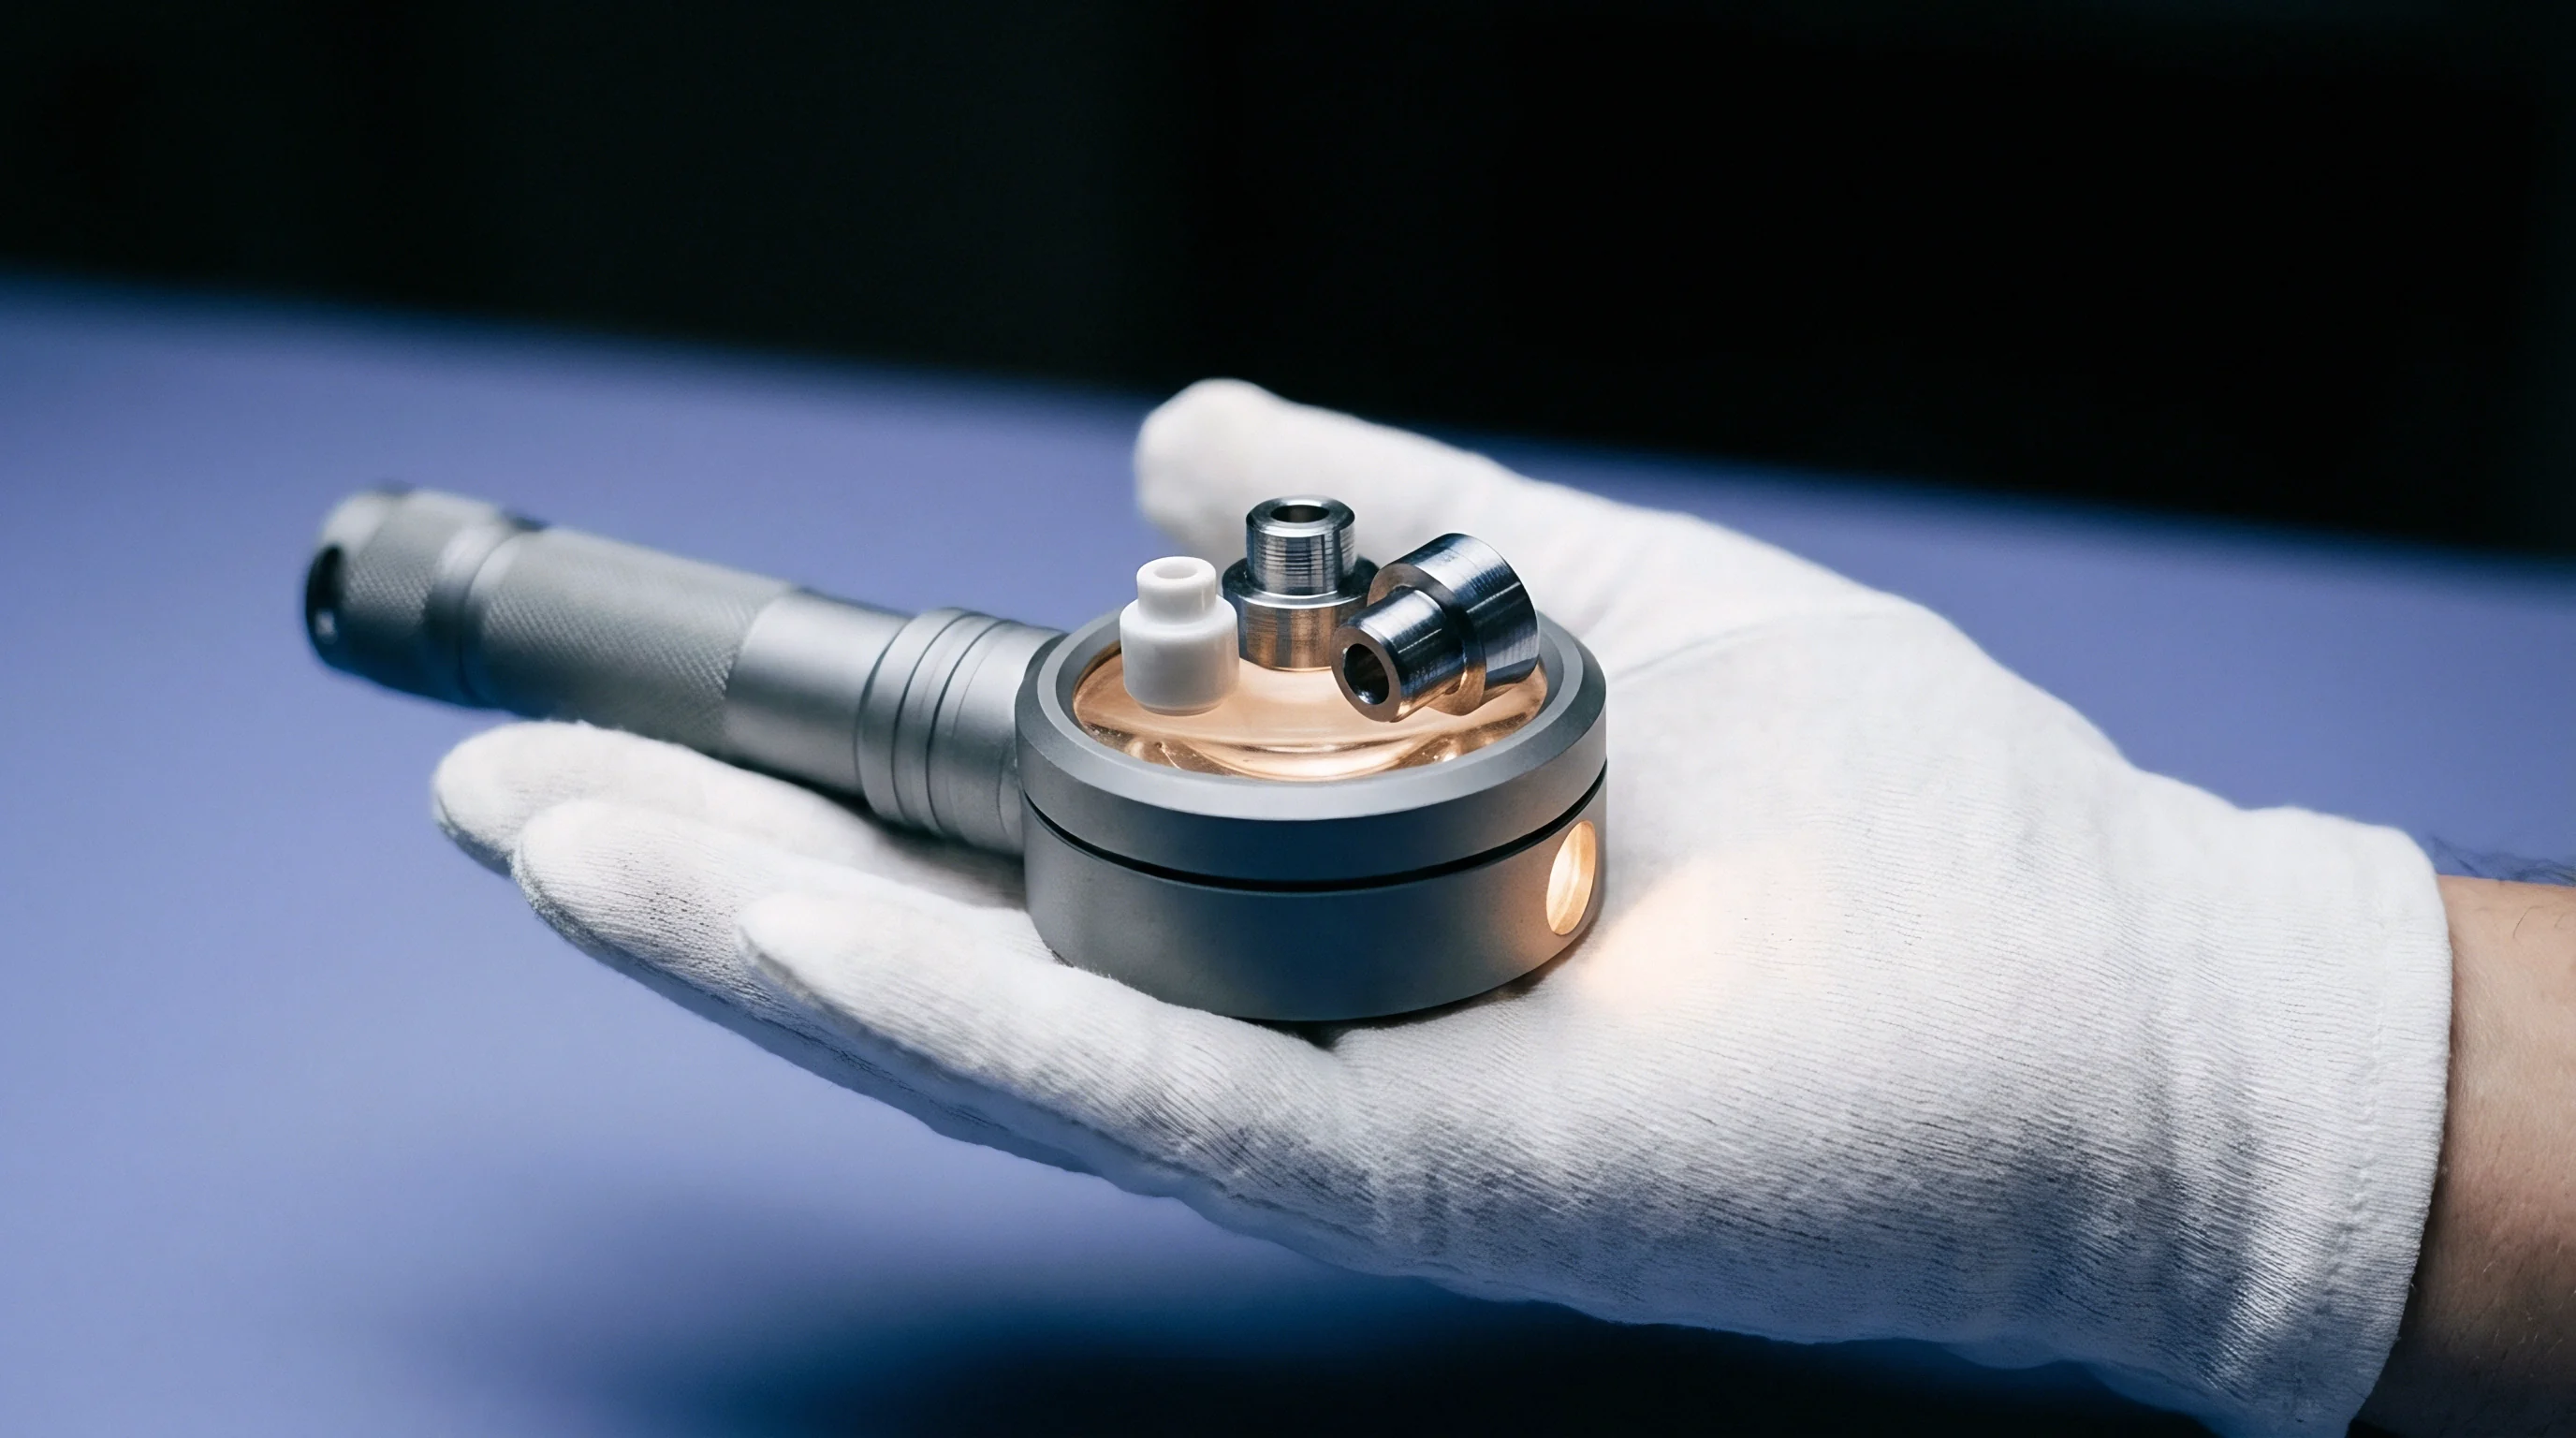

Crucible
Receiving inspection for liquid resin systems, reactive hot melts, and elastomer compounds relies on dual physical benchmarks that capture flow behavior and molecular structure. Delivery drums sitting on receiving bays often carry Certificates of Analysis showing acceptable melt flow rates or low-shear Brookfield measurements. Processing problems appear when these formulations enter high-speed slot dies, automated dispensing nozzles, or injection molds.
High shear rheology measures the material under real processing stresses between 103 s-1 and 106 s-1. Differential Scanning Calorimetry, abbreviated as DSC, tracks the thermodynamic fingerprint, including glass transition temperature (Tg), melting enthalpy (Δ Hm), and reaction kinetics. Together, these methods expose batch-to-batch variations, improper monomer ratios, and heat exposure during ocean transit before raw materials enter assembly lines.

Incoming Lot Screening Parameters
Receiving verification begins with a two-tier screening protocol applied to incoming lots before drum unloading or tank transfer. Standard quality control reports from chemical suppliers frequently rely on single-point rotational measurements at shear rates below 100 s-1. These low-shear values mask polymer branching discrepancies, molecular weight distribution changes, and fill-level shifts that alter fluid flow under production conditions.
High shear capillary rheometry reveals shear-thinning indices, yield stress thresholds, and flow instabilities such as sharkskin melt fracture. Concurrently, DSC thermal scans assess chemical identity and thermal history. A baseline shift in glass transition temperature indicates plasticizer migration, solvent retention, or monomer ratio errors.
Measuring heat of reaction during dynamic heating scans confirms whether pre-gelation occurred during storage or transport.
Receiving dock verification prevents non-conforming polymer shipments from entering active inventory. Testing every incoming container is financially unfeasible for high-volume operations. Receiving protocol requires statistical sampling according to ISO 2859-1 normal inspection level II, taking representative draws from the top, middle, and bottom of selected drums.
Testing teams combine high shear rheology curves across shear rates from 500 s-1 to 100,000 s-1 with DSC thermal transition curves. Discrepancies between supplier test records and receiving laboratory data trigger quarantine holds before production lines stall.
Viscosity values obtained at low shear rates fail to predict fluid flow during high-speed automated dispensing.

Physical Sampling at Dock Delivery
Sample collection routines determine the technical validity of incoming analytical measurements. Polymer resins and filled compound lots suffer from phase separation, filler settling, and thermal gradients during long transit cycles. Liquid shipments require mechanical homogenization or recirculating pump cycles before specimen withdrawal.
Sampling equipment must maintain chemical inertia; stainless steel thief samplers or PTFE syringe tubes prevent sample contamination.
- Container Isolation – Isolate selected lot containers on the receiving dock and inspect external security seals for physical damage or temperature indicator alerts.
- Thermal Stabilization – Allow sealed sample containers to equilibrate inside the testing laboratory for four hours until internal temperature reaches twenty-three degrees Celsius.
- Homogenization Draw – Agitate liquid resin drums using a sealed pneumatic drum mixer for fifteen minutes before withdrawing liquid specimens into nitrogen-purged glass vials.
- Crucible Preparation – Transfer five to ten milligrams of solid resin or liquid paste into an aluminum DSC pan, seal with a hermetic crimping press, and record specimen mass to within zero point zero one milligrams.
- Capillary Loading – Charge the pre-heated barrel of a capillary rheometer with sample material, tap to purge air pockets, and allow five minutes for complete thermal equilibrium before piston actuation.
Viscous heating alters the observed curve. Indium calibration fixes baseline tilt. Wall slip distorts raw pressure drops.
Sealed aluminium pans prevent sample loss. Enthalpy shifts mark unreacted resin. Nitrogen flow removes volatile off-gassing.
Yield stress delays slot die filling. Die swell ratio indicates elastic recovery. Second heat scans remove processing history.
Uncured monomer depresses glass transition.
A supplier certificate listing low-shear viscosity provides zero assurance against high-speed dispensing failure.


Strain
Capillary rheometers force molten polymer or liquid formulations through precision dies at shear velocities exceeding ten thousand reciprocal seconds. Standard capillary dies operate with length-to-diameter (L/D) ratios ranging from ten to thirty. Processing conditions inside slot dies, spray nozzles, and high-speed coating heads subject materials to extreme velocity gradients.
Measuring viscosity across these shear rates isolates non-Newtonian behaviors such as shear thinning, shear thickening, and structural breakdown. Raw pressure transducer readings along the rheometer barrel reflect both viscous resistance and entrance-exit pressure losses. Converting raw transducer data into true shear stress demands rigorous mathematical corrections.

Capillary Corrective Methods
Raw capillary rheometer data overestimates fluid shear stress due to extensional flow pressure drops occurring at the die entrance. The Bagley correction eliminates this entry pressure loss by testing the lot specimen through at least two dies of identical orifice diameter but differing capillary lengths. Plotting measured pressure against die L/D ratios yields a linear regression line; extrapolating this line to zero length defines the entrance pressure drop (Δ Pe).
Subtracting Δ Pe from total measured pressure isolates true wall shear stress.
Non-Newtonian fluids deviate from parabolic velocity profiles inside circular dies. The Rabinowitsch-Mooney correction adjusts raw shear rate calculations to account for fluid pseudoplasticity. True wall shear rate (dotγw) calculation incorporates the non-Newtonian index (n’), derived from the slope of logarithmic wall shear stress versus apparent shear rate.
Without the Rabinowitsch correction, high shear viscosity measurements underestimate true fluid shear resistance by up to thirty percent in strongly shear-thinning polymers.
| Measurement Technique | Shear Rate Range (s⁻¹) | Primary Applied Standard | Required Raw Data Correction | Receiving Verification Focus |
|---|---|---|---|---|
| Capillary Rheometry | 10³ to 10⁶ | ASTM D3835 / ISO 11443 | Bagley Entrance & Rabinowitsch | High-speed die flow & melt fracture |
| High-Shear Cone & Plate | 10² to 10⁴ | ASTM D4287 / ISO 2884-1 | Viscous Dissipation Heating | Automated brush & roll coating viscosity |
| Slit Die Rheometry | 10² to 10⁵ | DIN 54811 | Wall Slip & Pressure Tap Deflection | Inline extrusion & sheet forming profile |
| Microfluidic Rheometry | 10³ to 10⁶ | ASTM D7867 | Kinetic Energy & Viscous Drag | Injectable pharmaceuticals & jet inks |

Rotational Cone Plate Shear Thresholds
Rotational cone-and-plate rheometers complement capillary instruments by evaluating mid-to-high shear viscosity under uniform shear rates. Cone angles below two degrees ensure constant shear rates throughout the sample gap. Cone-and-plate geometry experiences secondary flows and sample edge expulsion at shear rates above five thousand reciprocal seconds.
Testing teams set shear rate sweeps to cap immediately below the critical shear velocity where sample fracture occurs.
Polymer lots exhibiting premature edge failure during cone-and-plate testing often carry excessive elastic strain energy. Measuring normal stress differences (N1) during rotational shear quantifies material elasticity. Elevated normal stress causes die swell during processing, altering final extrudate dimensions.
Tracking the ratio of shear stress to normal stress provides an incoming acceptance criterion for precision extrusion applications.
A capillary rheology profile measured at ten thousand reciprocal seconds and adjusted with Bagley and Rabinowitsch corrections establishes true processing viscosity within three percent tolerance.
Capillary geometry forces high shear rates. Solvent retention lowers thermal stability. Calibration drift corrupts heat flux readings.
Dynamic viscosity collapses under rapid shear. Crosslinking enthalpy defines cure state. Thermal degradation alters peak melt area.

Viscous Dissipation and Slip Artefacts
High shear testing generates internal thermal energy within viscous fluid samples. Viscous heating lowers localized fluid viscosity during testing, producing artificial shear-thinning signatures on high-speed sweeps. Advanced capillary rheometer software applies non-isothermal temperature corrections based on adiabatic temperature rise estimates.
Laboratory technicians mitigate viscous heating by utilizing short dwell times and temperature-compensated transducer arrays.
Wall slip presents another major analytical artefact during lot receiving verification. Highly fluorinated polymers, filled silicone compounds, and highly loaded ceramic pastes slip along metal die walls rather than adhering to boundary surfaces. Slippage yields artificially low calculated viscosity values.
Using capillary dies with roughened internal bores or comparing data across multiple die diameters reveals wall slip velocity, allowing receiving inspectors to separate genuine fluid flow properties from boundary sliding.
An unexpected drop in high-shear viscosity stems from low batch molecular weight rather than testing error.
The chemical vendor claimed that shear thinning variations across raw resin shipments fall within normal manufacturing distribution and cause no operational impact during automated dispensing.


Phase
Differential thermal analysis tracks heat capacity changes and phase transitions across controlled temperature ramps from minus eighty to three hundred degrees Celsius. DSC instruments measure heat flow differences between an sample container and an empty reference crucible. Phase changes such as glass transitions (Tg), crystallization events (Tc), melting points (Tm), and chemical curing reactions (Δ H) appear as endothermic or exothermic baseline deflections.
Small chemical alterations in incoming raw material lots generate distinct thermal transition shifts.

Glass Transition Shifts and Monomer Content
Glass transition temperature defines the reversible thermal boundary where an amorphous polymer shifts from a brittle, glassy state to a flexible, rubbery matrix. Glass transition measurements follow ASTM E1356 or ISO 11357-2 standards, utilizing the half-extrapolated mid-point of the endothermic step change in heat capacity. Unreacted monomer, residual solvent, or moisture contamination acts as an internal plasticizer, depressing the observed glass transition temperature.
Conversely, accidental crosslinking or improper stoichiometry elevates Tg.
Receiving acceptance windows set strict boundaries on glass transition deviations. A lot showing a three-degree Celsius downward shift in Tg indicates solvent retention exceeding zero point five percent by mass. This residual volatile content causes outgassing during high-temperature curing cycles, generating micro-voids in structural adhesive lines.
Thermal history erasure is mandatory: testing technicians run a first heating scan, cool the sample at twenty degrees Celsius per minute below Tg, and measure baseline parameters strictly on the second heating cycle.
| Thermal Parameter | Measurement Standard | Unit | Acceptance Band | Physical Failure Mode |
|---|---|---|---|---|
| Glass Transition (Tg) | ASTM E1356 | °C | ± 2.0 from Nominal | Plasticizer loss or solvent retention |
| Melting Point (Tm) | ISO 11357-3 | °C | ± 1.5 from Nominal | Polymer blend immiscibility |
| Reaction Enthalpy (Δ H) | ASTM E2160 | J/g | ± 5% of Baseline | Partial pre-curing or bad active ratio |
| Oxidative Induction Time | ASTM D3895 | Minutes | > 30.0 at 200°C | Antioxidant additive depletion |

Is High Shear Rheology Superior for Lot Acceptance?
High shear rheology measures bulk fluid deformation, whereas differential scanning calorimetry exposes molecular structure and thermodynamic state. Liquid polymer lot acceptance requires both techniques because flow properties and chemical cure parameters operate independently. A resin lot can pass high shear viscosity checks while containing degraded crosslinking agents that destroy final mechanical strength.
Relying on rheology alone allows chemically compromised lots into production lines, while relying on DSC alone misses physical dispersion failures.
Thermal history erasure via a controlled first heating cycle prevents packaging stress and storage temperatures from biasing glass transition measurements.
Enthalpy of Cure and Polymer Crystallization
Thermosetting polymer lots, including epoxy formulations, polyurethane resins, and dicyandiamide-cured systems, undergo irreversible exothermic crosslinking reactions upon thermal activation. Integrating the exothermic peak area on a DSC heating trace calculates total reaction enthalpy (Δ Hc) in Joules per gram. Incoming thermoset resin lots exhibiting reduced reaction enthalpy compared to baseline standards have suffered partial pre-gelation due to improper storage temperatures during ocean freight shipping.
Crystalline and semi-crystalline thermoplastics show distinct melting peaks (Δ Hm) and cold crystallization peaks (Δ Hcc). Deviations in cold crystallization enthalpy indicate incomplete crystallization during pelletization or supplier process fluctuations. Comparing the ratio of melting enthalpy to cold crystallization enthalpy confirms degree of crystallinity, ensuring incoming plastic resin lots maintain mechanical impact resistance.
- 1. Extract representative five-milligram samples from three distinct delivery containers per lot.
- 2. Encapsulate specimens in standard aluminum pans using a zero-clearance crimping die.
- 3. Purge the sample chamber with dry nitrogen gas at fifty milliliters per minute flow rate.
- 4. Heat specimen from room temperature to two hundred degrees Celsius at ten degrees per minute to record initial thermal state.
- 5. Quench sample to minus fifty degrees Celsius at forty degrees per minute to erase physical aging history.
- 6. Execute second heating ramp at ten degrees per minute, recording glass transition mid-point and enthalpy peak integrations.
Does dynamic mechanical analysis provide sufficient sensitivity to replace dual receiving verification routines when high shear rheology and DSC yield conflicting acceptance verdicts?


Clamp
Laboratory instruments require precise mechanical anchoring and calibrated sample containers to prevent measurement error during high-speed shear runs or thermal cycling. Rheometer barrels, capillary die clamping assemblies, and DSC furnace lids must achieve tight physical sealing. Inadequate clamp pressure on capillary dies permits material leakage around entry seals, venting pressure and corrupting calculated wall shear stresses.
Sealed DSC pans maintain constant sample mass during high-temperature thermal sweeps, eliminating heat capacity calculation errors caused by volatile loss.

Temperature Control and Crucible Sealing
Sample containers for DSC testing come in direct contact with sensor thermocouples inside the silver furnace cell. Hermetic aluminum pans withstand internal vapor pressures up to three bars without pan distortion. Technicians adjust the crimping clamp tool to press pan covers uniformly into sealing rings.
Unsealed pans allow volatile solvents, resin diluents, or absorbed ambient moisture to evaporate during thermal ramps. Evaporation absorbs heat, generating broad endothermic baseline artifacts that obscure true polymer glass transitions.
Capillary rheometer barrels utilize multi-zone electric heaters to maintain thermal stability within zero point one degree Celsius along the flow path. Temperature gradients across the barrel length alter localized fluid viscosity, shifting the apparent velocity profile. Clamping thermal insulation jackets around the rheometer barrel minimizes radiant heat loss.
Barrel thermal calibration requires inserting calibrated platinum resistance thermometers directly into the melt chamber prior to lot testing runs.
Non-conforming raw material lots allowed into automated assembly lines generate line stoppage costs exceeding fifty thousand dollars per hour.

Calibration Routines and Baseline Stability
Analytical accuracy depends on regular instrument calibration verified against international standard reference materials. DSC temperature and heat flow calibration utilizes high-purity Indium (Tm = 156.60circC, Δ H = 28.45 J/g) and Zinc standards. Calibration runs confirm furnace symmetry, baseline flatness, and sensor time constants.
Baseline drift exceeding five microwatts over a hundred-degree temperature span requires furnace cleaning and thermocouple recalibration.
Capillary rheometers undergo pressure transducer calibration using dead-weight testers or primary hydraulic pressure references across full operating ranges. Transducer signal drift distorts low-end shear stress values, invalidating Bagley entry pressure extrapolation calculations. Checking zero-pressure offsets at working temperatures prevents systematic measurement shifts during incoming lot verification.
- Die Alignment Tooling – Precision alignment sleeves ensure capillary die concentricity with barrel bores, preventing piston wear and side-load pressure friction artifacts.
- Torque Limiting Clamps – Calibrated torque wrenches lock rheometer capillary die retaining nuts to specification, eliminating thread distortion and high-pressure leakage paths.
- Hermetic Pan Press – Calibrated mechanical crimpers compress aluminum sample pans with controlled force, achieving uniform thermal contact resistance against furnace sensor plates.
- Purge Gas Controllers – Mass flow controllers supply high-purity nitrogen purge gas at constant flow rates, suppressing sample oxidation and keeping furnace sensors free of condensation.
Neglecting furnace cleaning protocols allows off-gassing residues to condense on sensor thermocouple plates, causing baseline calibration drift and invalidating historical lot transition comparisons across subsequent operating quarters.


Arithmetic
Financial balance sheets feel the direct impact of lot disposition choices made at the receiving dock. Catching non-conforming polymer shipments prior to factory intake saves money by avoiding scrap production, assembly line cleaning, and warranty claims. Incoming lot receiving verification incurs direct expenditures for laboratory hardware, skilled technical labor, and analytical consumables.
Managing cross-border supply chains requires balancing these testing costs against the commercial risks of deploying off-specification chemical formulations.

Cost Variance of Lot Disposition Scenarios
Commercial lot verification economics compare three distinct pathways upon receiving a non-conforming twenty-tonne resin shipment: full lot rejection with return to supplier, lot acceptance under concession with line speed derating, or local offshore reprocessing and blending. The financial comparison incorporates freight penalties, assembly line downtime, scrap waste metrics, and administrative re-inspection costs.
Consider a twenty-tonne lot of high-performance structural epoxy resin valued at twelve dollars per kilogram, totaling two hundred forty thousand dollars shipment value. Receiving verification reveals a shear-thinning viscosity failure where viscosity under high shear exceeds specification by twenty-five percent. This high viscosity will overload automated dispensing pumps, slowing production lines by forty percent.
| Cost Component | Option A: Immediate Rejection & Return | Option B: Production Line Derating | Option C: On-Site Additive Blend Rework |
|---|---|---|---|
| Raw Material Value | $240,000 (Credited) | $240,000 (Paid) | $240,000 (Paid) |
| Return Freight & Customs Duty | $18,500 | $0 | $0 |
| Production Downtime Cost | $45,000 (3-day line pause) | $112,000 (Slower line speed) | $15,000 (1-day rework delay) |
| Rework & Chemical Additives | $0 | $0 | $8,400 |
| Secondary Quality Testing | $1,200 | $2,400 | $4,800 |
| Scrap & Defect Risk Exposure | $0 | $38,000 | $3,200 |
| Total Financial Cost | $64,700 | $152,400 | $31,400 |

Financial Risk Modeling for Unverified Shipments
Deploying raw materials without receiving testing transfers technical liability to end-product manufacturing lines. Statistical risk modeling evaluates expected monetary loss (EL) using failure probability (Pf) multiplied by total defect consequence cost (Cd). Historical supplier audit data indicates cross-border chemical lot defect rates average three point five percent across unverified supply chains.
For an annual consumption of fifty resin lots, unverified receiving intake yields an expected monetary loss calculation: fifty lots multiplied by zero point zero three five failure probability yields one point seven five defective lots per year. With average line disruption and product failure costs running two hundred thousand dollars per incident, unverified intake creates an annual risk exposure of three hundred fifty thousand dollars. Operating an in-house receiving laboratory equipped with high shear rheology and DSC instruments carries an amortized annual operating cost of eighty-five thousand dollars, yielding a net annual saving of two hundred sixty-five thousand dollars.
Quality claims submitted under ISO 9001 supply framework agreements require certified laboratory test reports generated within seventy-two hours of dock arrival.
Investment payback on combined high shear rheometer and DSC test equipment completes within six months of deployment by preventing a single catastrophic line failure event.


Clause
Contractual purchase specifications governing high-performance polymers depend on explicit technical parameters tied to receiving verification. Vague supply agreements citing commercial grade names or generic viscosity ranges leave buyers legally unprotected when off-specification lots disrupt manufacturing operations. Master Supply Agreements must specify exact analytical testing standards, sample preparation procedures, acceptance windows, and binding dispute resolution routines.

Certificate of Analysis Validation Criteria
A Certificate of Analysis (CoA) provided by a chemical manufacturer represents a legal declaration of product conformance. Standard supplier CoAs often present data measured at factory release points prior to overseas shipping, exposure to thermal cycling, and physical agitation. Framework contracts require suppliers to report dual-tier testing values, including both high shear rheology data and DSC transition figures, generated on lot samples drawn after final packaging.
Contract terms specify that incoming CoA metrics must match buyer receiving verification tests within agreed statistical tolerances. Discrepancies exceeding defined threshold limits automatically void lot acceptance, placing financial responsibility for quarantine, return freight, and replacement logistics entirely on the supplier.
- Testing Method Citation – Quality contracts must reference explicit test standards including ASTM D3835 for capillary rheology and ASTM E1356 for glass transition analysis.
- Acceptance Window Specifications – Numerical acceptance boundaries require defined upper and lower control limits rather than single target values.
- Dispute Laboratory Designation – Contracts must pre-select an independent ISO/IEC 17025 accredited analytical laboratory to conduct binding arbitration testing on disputed lot samples.
- Quarantine Storage Responsibility – Provisions allocate warehousing costs to the vendor during active lot non-conformance investigations and technical reviews.

Arbitration Terms for Technical Non-Conformance
When buyer receiving verification conflicts with supplier CoA data, formal non-conformance protocols initiate automatically. Contracts mandate that the buyer notify the supplier in writing within ten business days of lot delivery, providing certified laboratory reports detailing non-conforming parameters. Disputed lots remain locked in quarantine under controlled environmental storage.
Re-testing protocols require drawing sealed referee samples stored under neutral custody. The pre-designated arbitration laboratory evaluates referee samples using identical testing procedures. Arbitration lab findings override initial test reports and establish final legal disposition of the shipment.
Clause 14.3 of the International Chemical Supply Agreement establishes that when buyer receiving tests demonstrate a glass transition temperature depression exceeding two point five degrees Celsius or high shear viscosity deviations beyond eight percent of target specification, the buyer retains immediate rights to reject the shipment, debit the supplier account for return freight liabilities, and demand replacement lot delivery within fourteen business calendar days.